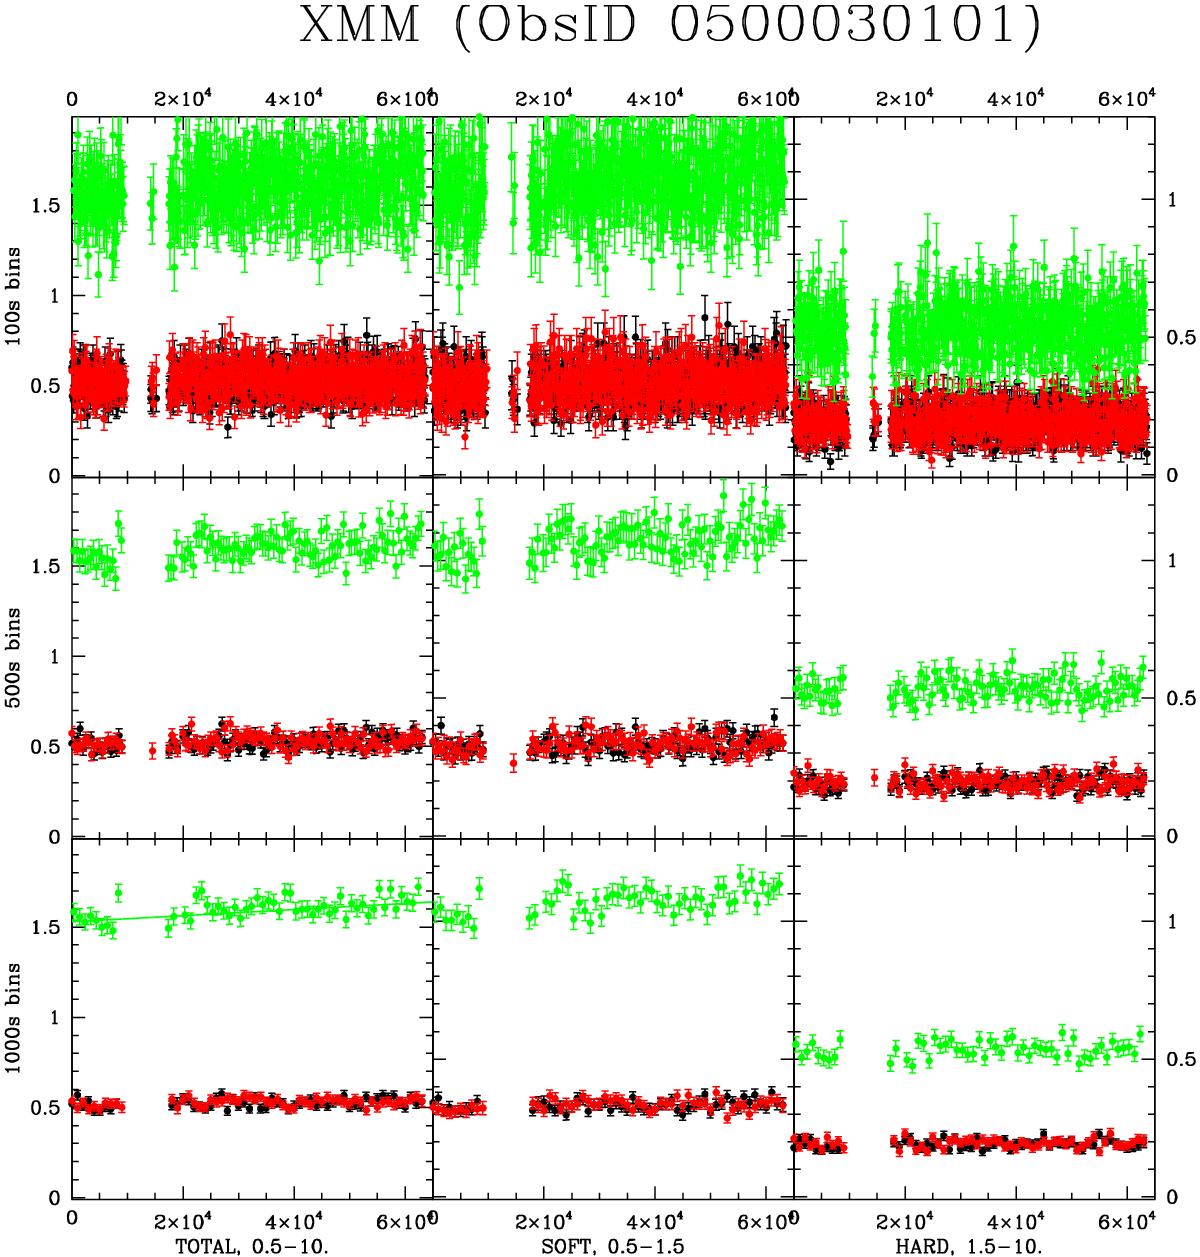
Fig. 2

Intra-pointing light curves of the first XMM-Newton observations (pn in green, MOS1 in black, MOS2 in red). The top, middle, and bottom panels show the light curves with 100 s, 500 s, and 1000 s time bins, respectively, while the left, central, and right panels display the total, soft, and hard light curves. The ordinates in cts s-1 are given on the left side for the total light curves, but on the right side for the soft and hard light curves. In the bottom left panel, the best-fit linear trend is superimposed onto the pn data.
Current usage metrics show cumulative count of Article Views (full-text article views including HTML views, PDF and ePub downloads, according to the available data) and Abstracts Views on Vision4Press platform.
Data correspond to usage on the plateform after 2015. The current usage metrics is available 48-96 hours after online publication and is updated daily on week days.
Initial download of the metrics may take a while.


