Fig. 1
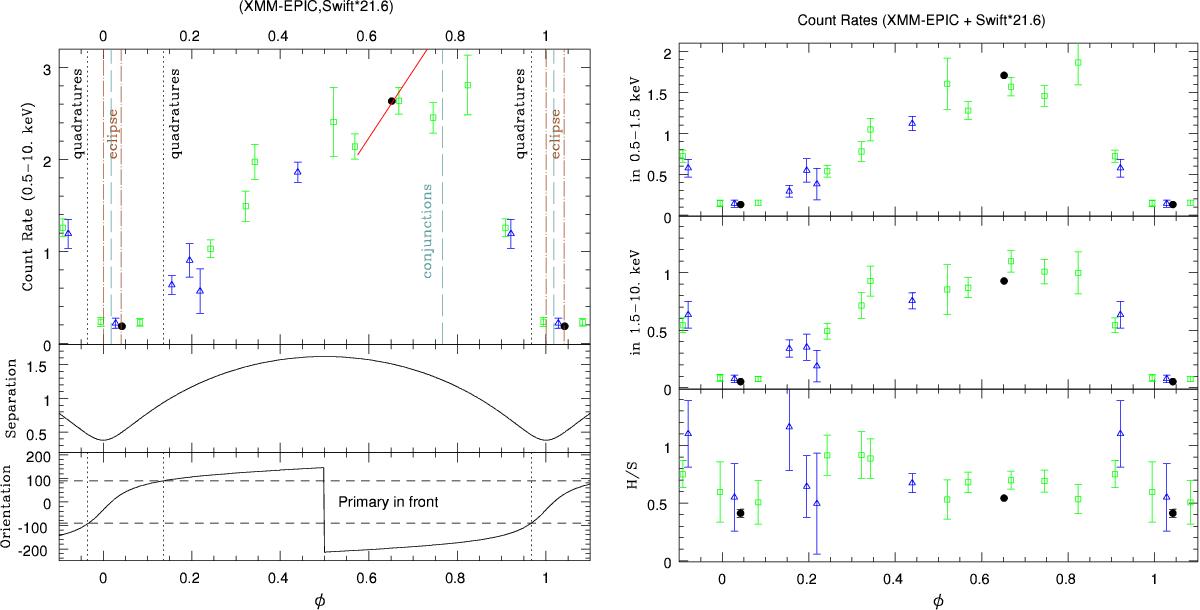
Variation in the count rates and hardness ratio with orbital phase for XMM-Newton (black dots) and Swift data (empty green squares for S-2 to 12 from February–March 2016, blue triangles for S-13 to 18 from April 2016; see Table 2). For all energy bands, Swift count rates and their errors were multiplied by 21.6 to clarify the trends (no further treatment was made for adjustment). In the top left panel, the straight red line represents the trend detected in the intra-pointing light curve of X-1. To help the comparison with physical parameters, the bottom left panels provide the orbital separation (in units of the semi-major axis a) as well as a position angle defined as zero when the O7.5I star (primary) is in front and 180° when the O9I star (secondary) is in front. The vertical lines in the top left panel indicate the phases of the quadratures, conjunctions, and optical eclipse start/end. All data are phased according to the ephemeris of Paper I.
Current usage metrics show cumulative count of Article Views (full-text article views including HTML views, PDF and ePub downloads, according to the available data) and Abstracts Views on Vision4Press platform.
Data correspond to usage on the plateform after 2015. The current usage metrics is available 48-96 hours after online publication and is updated daily on week days.
Initial download of the metrics may take a while.