Fig. 1
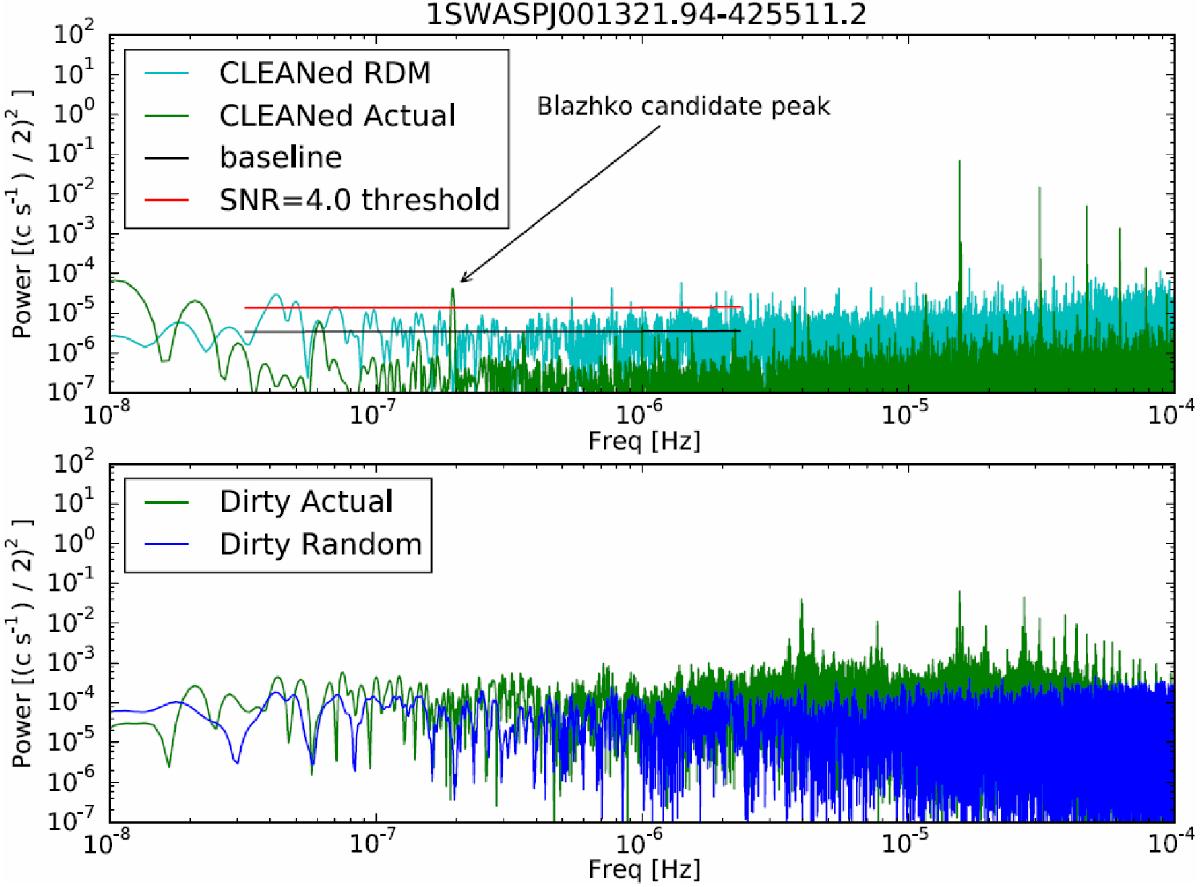
CLEANed power spectrum of 1SWASPJ001321.94-425511.2 from 10-8 Hz to 10-4 Hz. The top panel shows the power spectra of the original and randomised light curves after deconvolution with the CLEAN algorithm whilst the bottom panel shows the raw (or “dirty”) power spectra of the actual and randomised data. Peaks due to the actual signal can be seen more clearly once noise due to the convolution of the signal with the window function has been reduced. The red line in the top panel is the noise threshold calculated for frequencies below 2.3 × 10⁻⁶ Hz (equating to Blazhko periods of at least 5 days).
Current usage metrics show cumulative count of Article Views (full-text article views including HTML views, PDF and ePub downloads, according to the available data) and Abstracts Views on Vision4Press platform.
Data correspond to usage on the plateform after 2015. The current usage metrics is available 48-96 hours after online publication and is updated daily on week days.
Initial download of the metrics may take a while.