Fig. 8
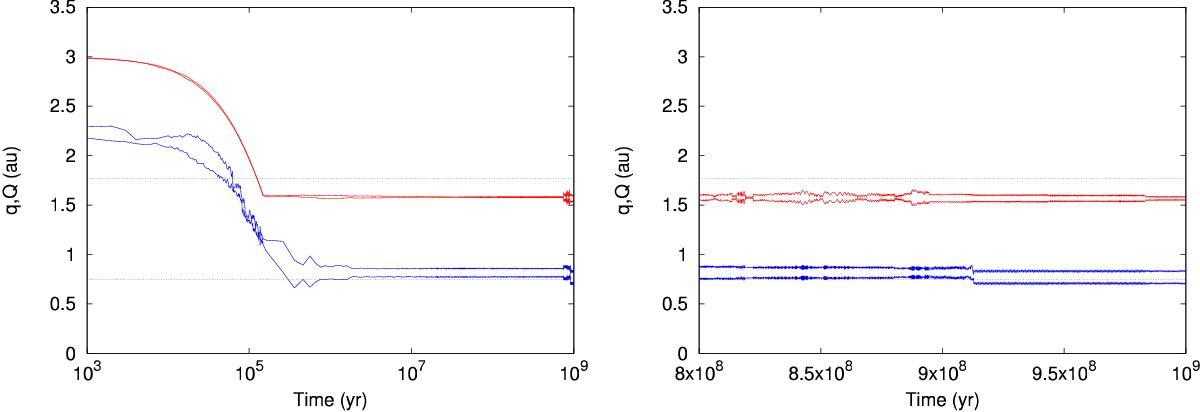
Evolution in time of perihelion and aphelion for the Jupiter-mass planet (red curve) and the planet surviving in the HZ (blue curve). The results displayed on the left panel correspond to Simulation 14 of Scenario 2. The right panel shows a zoom at the last 200 Myr of evolution, where a significant encounter shift the perihelion of the planet out of the inner edge of the HZ.
Current usage metrics show cumulative count of Article Views (full-text article views including HTML views, PDF and ePub downloads, according to the available data) and Abstracts Views on Vision4Press platform.
Data correspond to usage on the plateform after 2015. The current usage metrics is available 48-96 hours after online publication and is updated daily on week days.
Initial download of the metrics may take a while.