Fig. 7
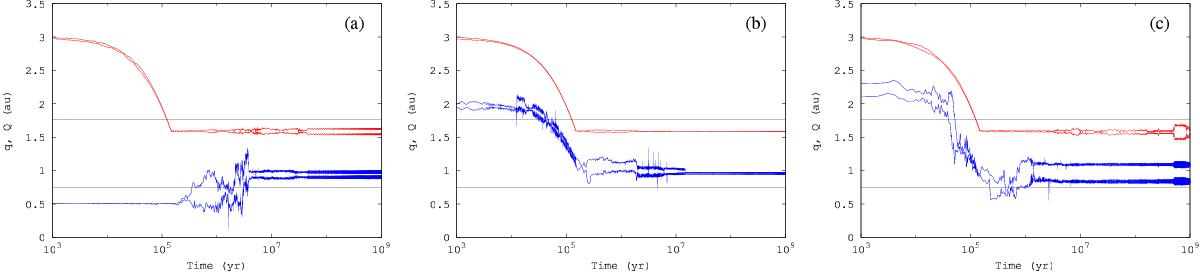
Evolution in time of perihelion and aphelion for the Jupiter-mass planet (red curve) and the planet surviving in the HZ (blue curve). These results, obtained from Simulations 1, 6 and 15 of Scenario 2, are shown in the panels a–c, respectively. The horizontal dashed lines represent the inner and outer edges of the optimistic HZ. These planetary configurations remain dynamically stable for 1 Gyr.
Current usage metrics show cumulative count of Article Views (full-text article views including HTML views, PDF and ePub downloads, according to the available data) and Abstracts Views on Vision4Press platform.
Data correspond to usage on the plateform after 2015. The current usage metrics is available 48-96 hours after online publication and is updated daily on week days.
Initial download of the metrics may take a while.