Fig. 3
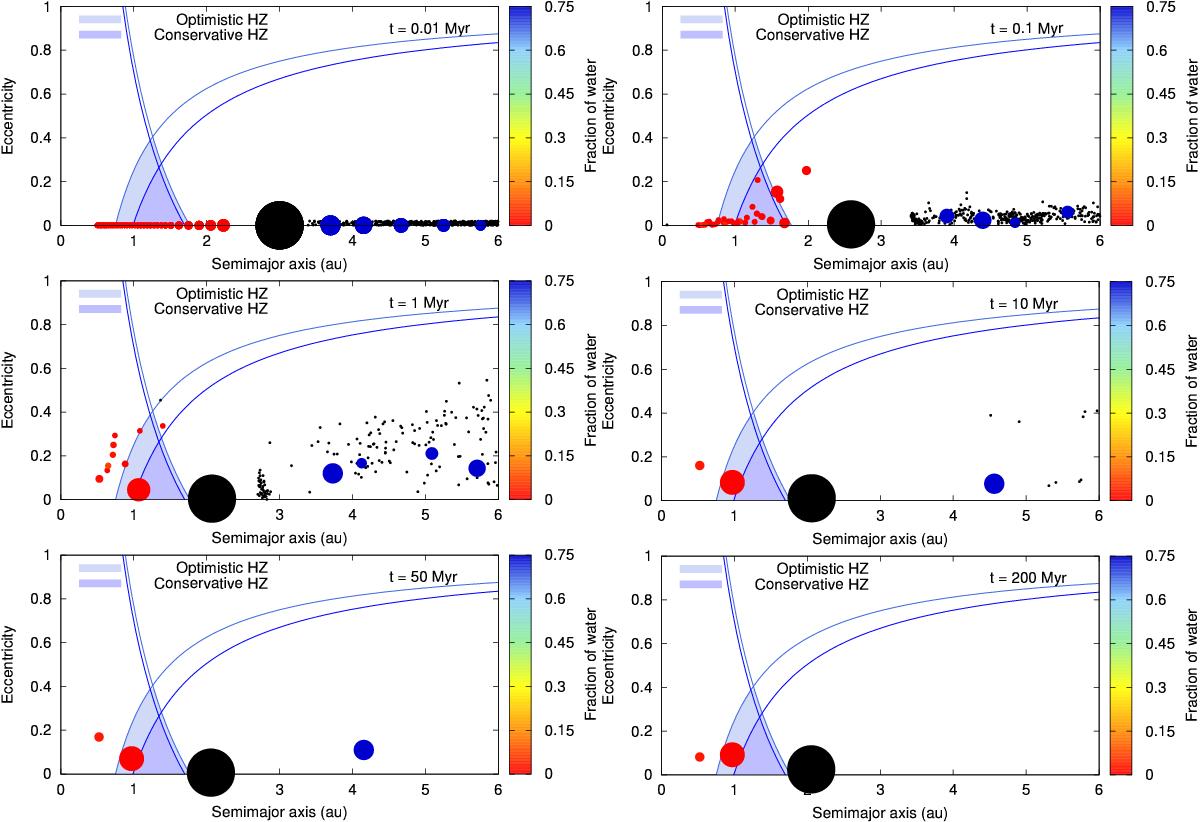
Snapshots of the dynamical evolution for Simulation 16 of Scenario 1. The blue and light-blue shaded areas represent the conservative and the optimistic HZ, respectively. In the same way, the blue and light-blue curves represent curves of constant perihelion and aphelion, both for the conservative and the optimistic HZ. The Jupiter-mass planet is plotted as a big black circle, the planetary embryos as coloured circles, and the planetesimals as small black points. The colour scale represents the fraction of water of the embryos respect to their total masses.
Current usage metrics show cumulative count of Article Views (full-text article views including HTML views, PDF and ePub downloads, according to the available data) and Abstracts Views on Vision4Press platform.
Data correspond to usage on the plateform after 2015. The current usage metrics is available 48-96 hours after online publication and is updated daily on week days.
Initial download of the metrics may take a while.