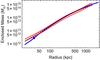
Fig. 7
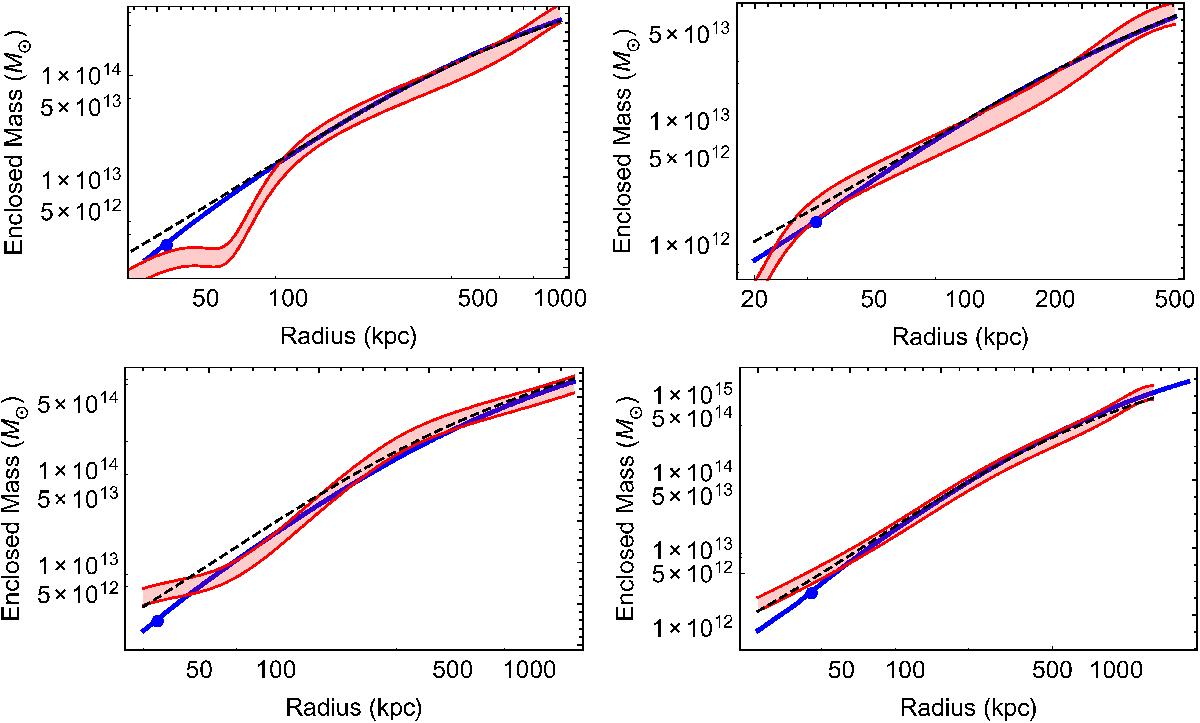
Same as Fig. 6 for the NFW normal phase. Only the case of Λm3 = 0.3 × 10⁻³ eV4/c8 is shown. rs for each cluster is defined as a fraction 1 /n of the virial radius, where n is 5, 6, 4, and 4 for clusters A133, A262, A468, and A1413, respectively. The NFW normal phase follows the ΛCDM prediction much more closely than the isothermal normal-phase model. Central regions are still consistently smaller than in the ΛCDM predictions, which needs to be investigated in further work.
Current usage metrics show cumulative count of Article Views (full-text article views including HTML views, PDF and ePub downloads, according to the available data) and Abstracts Views on Vision4Press platform.
Data correspond to usage on the plateform after 2015. The current usage metrics is available 48-96 hours after online publication and is updated daily on week days.
Initial download of the metrics may take a while.