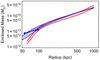
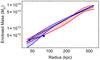
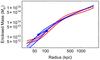
Fig. 6
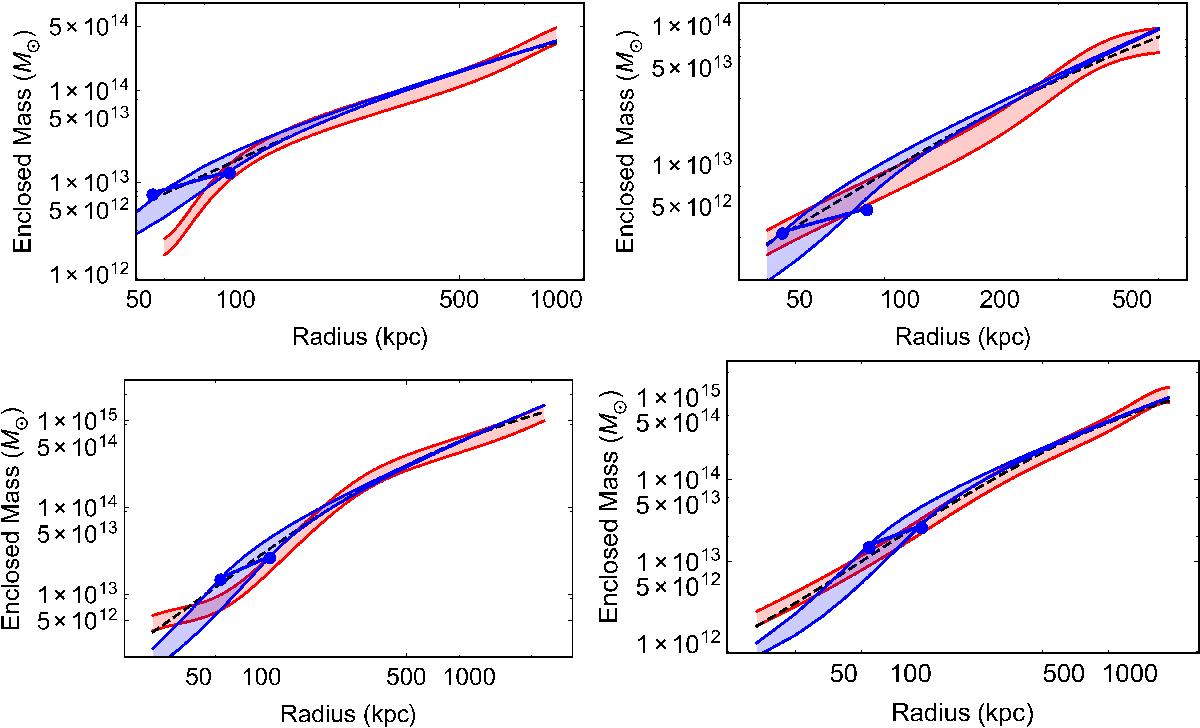
Enclosed mass profiles for the cluster sample. Red shaded regions show the ± 20% values of the dynamical mass calculated via Eq. (26). The blue shaded region shows the mass profile of the SfDM paradigm to highlight the Λm3 dependence (upper and lower bands represent a larger and smaller choice of Λm3, respectively). We chose parameters Λm3 = (0.1−0.3) × 10-3 eV4/c8. The black dashed line represents the NFW profile as given in Vikhlinin et al. (2006). Blue circles show the superfluid core radii for the upper and lower choices of Λm3. The best-fit analytical gas and temperature profiles did not force monotonically increasing dynamical masses. To account for this, we removed unphysical features from the plot. Top left: A133 with a virial mass of 6 × 10¹⁴M⊙, top right: A262 with a virial mass of 2 × 10¹⁴M⊙, bottom left: A478 with a virial mass of 1.5 × 10¹⁵M⊙, and bottom right: A1413 with a virial mass of 1.5 × 10¹⁵M⊙.

Current usage metrics show cumulative count of Article Views (full-text article views including HTML views, PDF and ePub downloads, according to the available data) and Abstracts Views on Vision4Press platform.
Data correspond to usage on the plateform after 2015. The current usage metrics is available 48-96 hours after online publication and is updated daily on week days.
Initial download of the metrics may take a while.