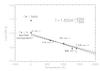
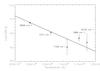
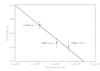
Fig. 7

Same as Fig. 6, but in three separate plots corresponding to the three domains. Top: low-energy levels. Middle: medium-energy levels. Bottom: high-energy levels. Least-squares fits of all available levels are shown as solid straight lines. For the low energy levels, the 0 cm-1 level corresponding to component 1 is not included in the fit (see text). Limits on the least-squares slope are shown as dashed lines for the low-energy levels, centered over the weighted average of the four excited levels. The population of the low-energy levels follow a Boltzmann distribution, which is consistent with an excitation temperature of about 1300 K.
Current usage metrics show cumulative count of Article Views (full-text article views including HTML views, PDF and ePub downloads, according to the available data) and Abstracts Views on Vision4Press platform.
Data correspond to usage on the plateform after 2015. The current usage metrics is available 48-96 hours after online publication and is updated daily on week days.
Initial download of the metrics may take a while.