Fig. 5
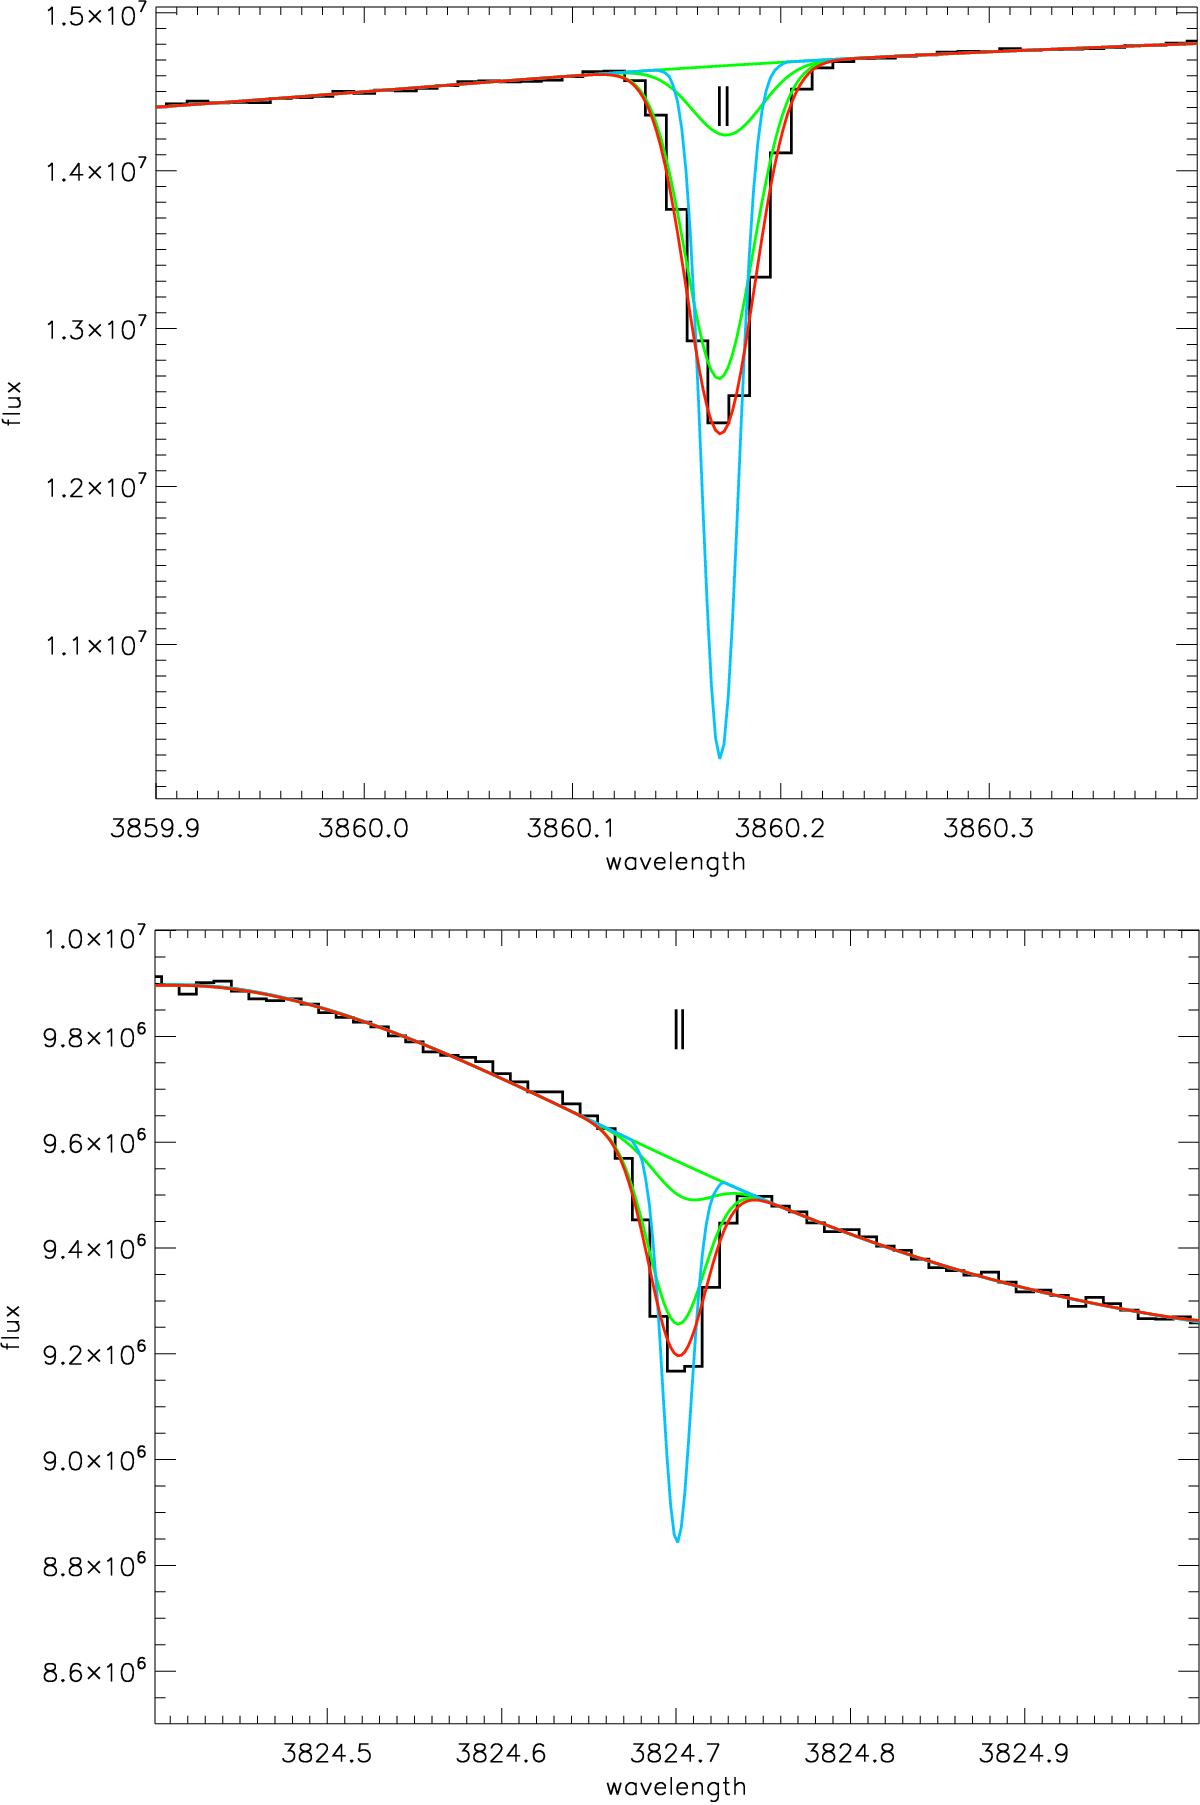
Same as Fig. 3 with two-component fits to the line absorption profiles. The positions of the two components are shown by two small vertical tick marks. The absorption profiles of each of the two components are shown by green lines. The redward component (1) is at the same radial velocity as the absorption from all excited levels. The blueward component (2) has a higher column density, but is detected only in the Fe I lines from the ground base level.
Current usage metrics show cumulative count of Article Views (full-text article views including HTML views, PDF and ePub downloads, according to the available data) and Abstracts Views on Vision4Press platform.
Data correspond to usage on the plateform after 2015. The current usage metrics is available 48-96 hours after online publication and is updated daily on week days.
Initial download of the metrics may take a while.