Fig. 4
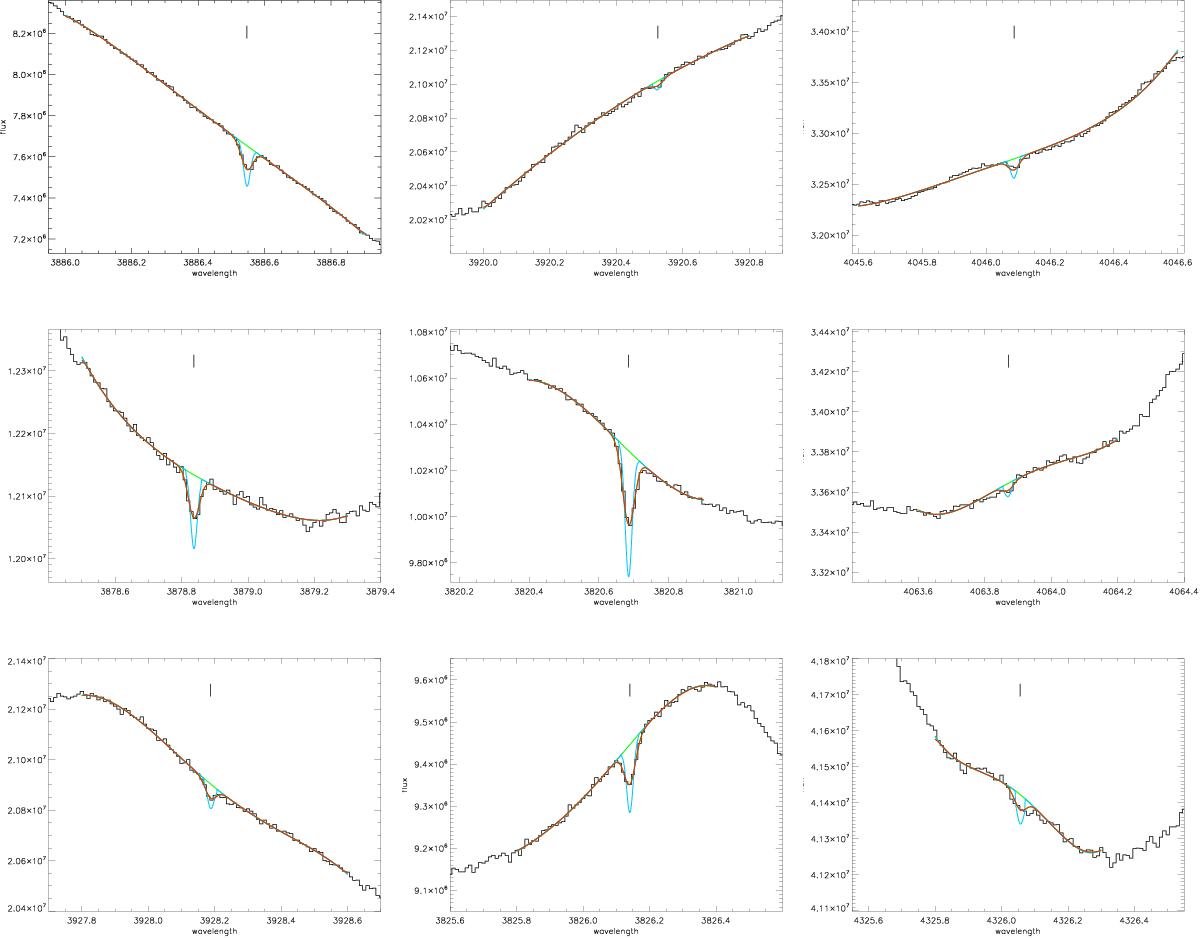
Simultaneous fits of the strongest Fe I lines from excited levels. First column: the 416 cm-1, 704 cm-1 and 888 cm-1 excited levels (from top to bottom). Second column: the 978 cm-1, 6928 cm-1 and 7377 cm-1 excited levels (from top to bottom). Third column: the 11 976 cm-1, 12 561 cm-1 and 12 969 cm-1 excited levels (from top to bottom). The stellar continuum is plotted with a green line, the intrinsic absorption profile with a blue line, and the absorption profile convolved with the HARPS instrument profile with a red line. The gas responsible for the absorption lines is defined as a unique component with the same radial velocity and line width (b value) for all the excited levels; the column densities of each excited level are independent. The positions of the absorption lines are indicated by a tick at +20.41 km s-1 radial velocity.
Current usage metrics show cumulative count of Article Views (full-text article views including HTML views, PDF and ePub downloads, according to the available data) and Abstracts Views on Vision4Press platform.
Data correspond to usage on the plateform after 2015. The current usage metrics is available 48-96 hours after online publication and is updated daily on week days.
Initial download of the metrics may take a while.