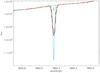
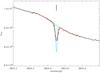
Fig. 3

Two Fe I β Pictoris lines from the ground base level (flux in arbitrary units as a function of wavelength in Å). The observations are shown as black histograms, the fitted stellar continuum as green lines. The blue lines represent the intrinsic absorption feature, and the red lines are its convolution with the HARPS instrumental profile. In the two lines, the intrinsic absorption profiles (blue lines) are far from saturated, implying that the column density of Fe I from the ground base level can be well constrained.
Current usage metrics show cumulative count of Article Views (full-text article views including HTML views, PDF and ePub downloads, according to the available data) and Abstracts Views on Vision4Press platform.
Data correspond to usage on the plateform after 2015. The current usage metrics is available 48-96 hours after online publication and is updated daily on week days.
Initial download of the metrics may take a while.