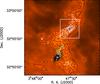
Fig. 1
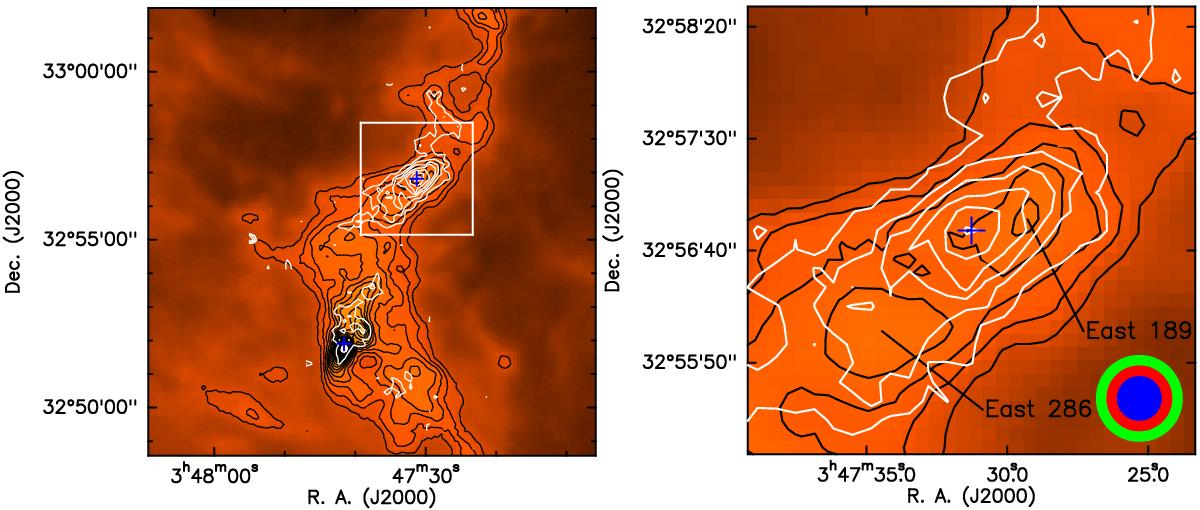
Herschel/SPIRE map of the Barnard 5 dark cloud at 250 μm (orange scale and black contours) and IRAM 30 m map integrated intensity map of the A+-CH3OH 30 − 20 transition at 145.103 GHz (white contours in step of 5σ, σ is equal to 50 mK km s-1). The blue crosses depict the positions of the Class I protostar IRS1 and the methanol hotspot of B5. The green, red, and blue circles at the bottom right of the right map represent the size of the beams of the OSO 20 m, the IRAM 30 m, and the NRO 45 m telescopes at 3 mm, respectively. The two dense cores surrounding the methanol hotspot have the following properties: East 189: M = 0.5M⊙, Td = 12 K, R = 3.6 × 10⁻² pc, nH = 3 × 104 cm-3, East 286: M = 0.7M⊙, Td = 9.9 K, R = 2.7 × 10⁻² pc, nH = 1.2 × 105 cm-3.
Current usage metrics show cumulative count of Article Views (full-text article views including HTML views, PDF and ePub downloads, according to the available data) and Abstracts Views on Vision4Press platform.
Data correspond to usage on the plateform after 2015. The current usage metrics is available 48-96 hours after online publication and is updated daily on week days.
Initial download of the metrics may take a while.