Free Access
Fig. 7
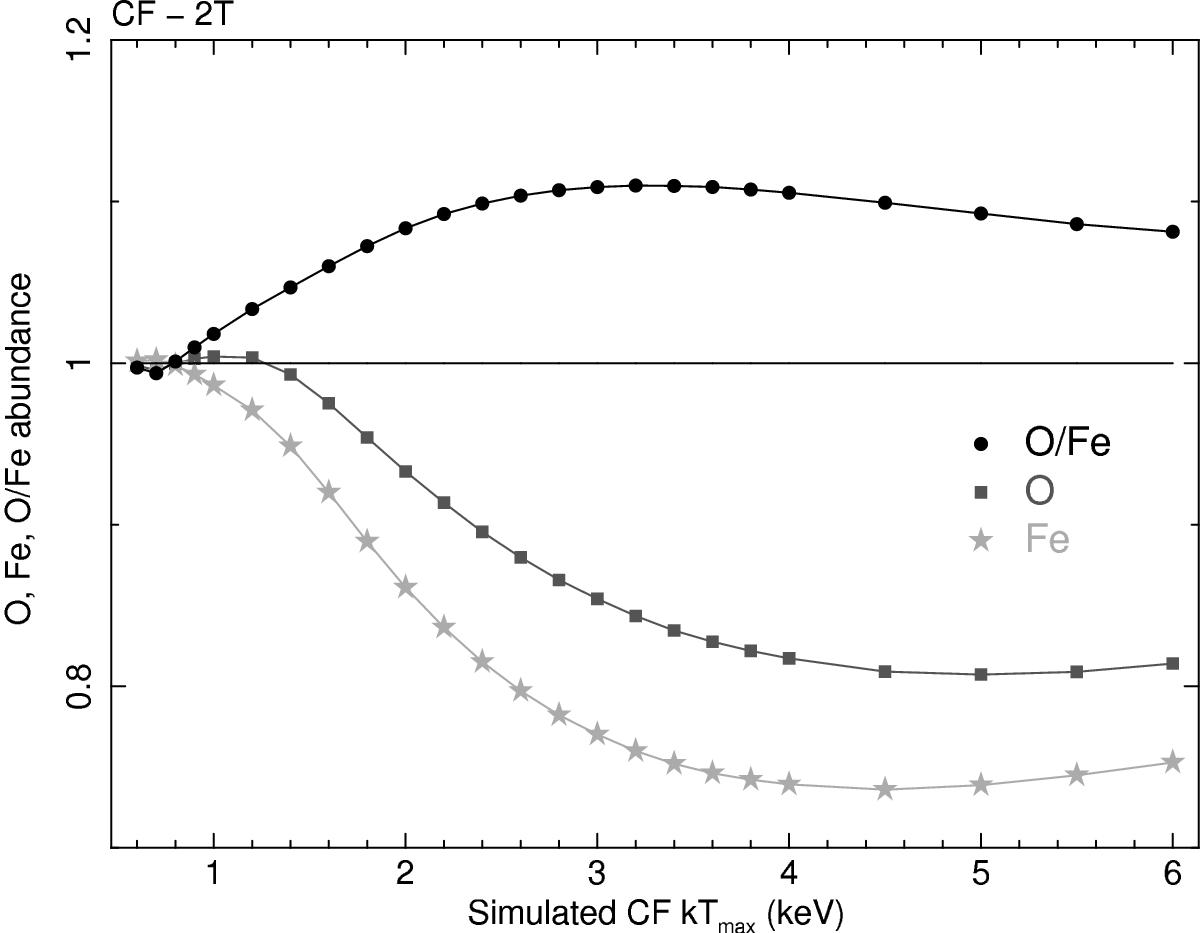
Results from two-temperature fits to simulated RGS cooling-flow spectra for a range of (maximum) temperatures. The measured O, Fe, and O/Fe abundances are shown and compared to their input value of once solar.
Current usage metrics show cumulative count of Article Views (full-text article views including HTML views, PDF and ePub downloads, according to the available data) and Abstracts Views on Vision4Press platform.
Data correspond to usage on the plateform after 2015. The current usage metrics is available 48-96 hours after online publication and is updated daily on week days.
Initial download of the metrics may take a while.