Fig. 6
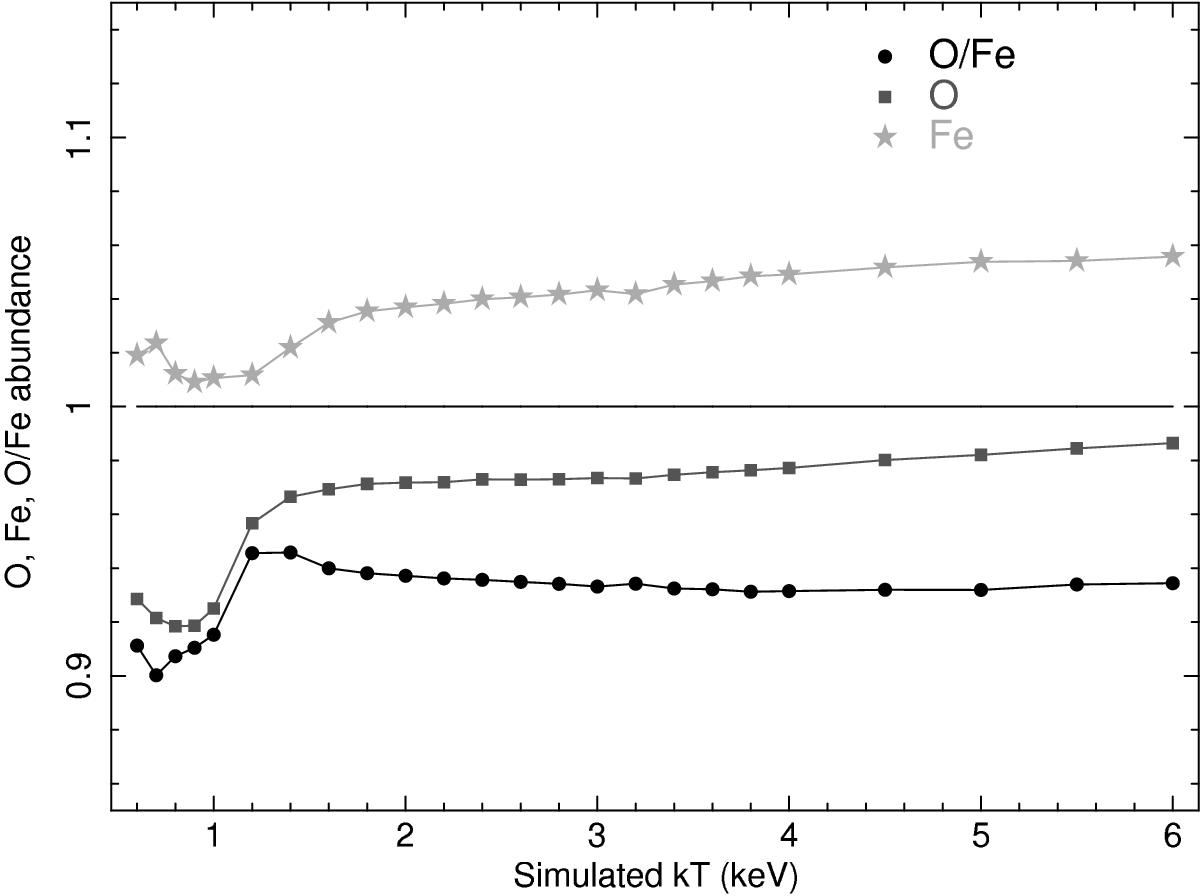
O, Fe, and O/Fe abundance results for fits to simulated spectra of a range of temperatures. In the simulated spectra, we set the width of the oxygen lines to be twice the width of the Fe lines. In the fit, this difference in width is not fit and is assumed to be the same for all lines. The squares and stars show the absolute O and Fe abundance, respectively. The circles show the O/Fe ratio. All measurements are compared to the input value of 1.
Current usage metrics show cumulative count of Article Views (full-text article views including HTML views, PDF and ePub downloads, according to the available data) and Abstracts Views on Vision4Press platform.
Data correspond to usage on the plateform after 2015. The current usage metrics is available 48-96 hours after online publication and is updated daily on week days.
Initial download of the metrics may take a while.