Free Access
Fig. 6
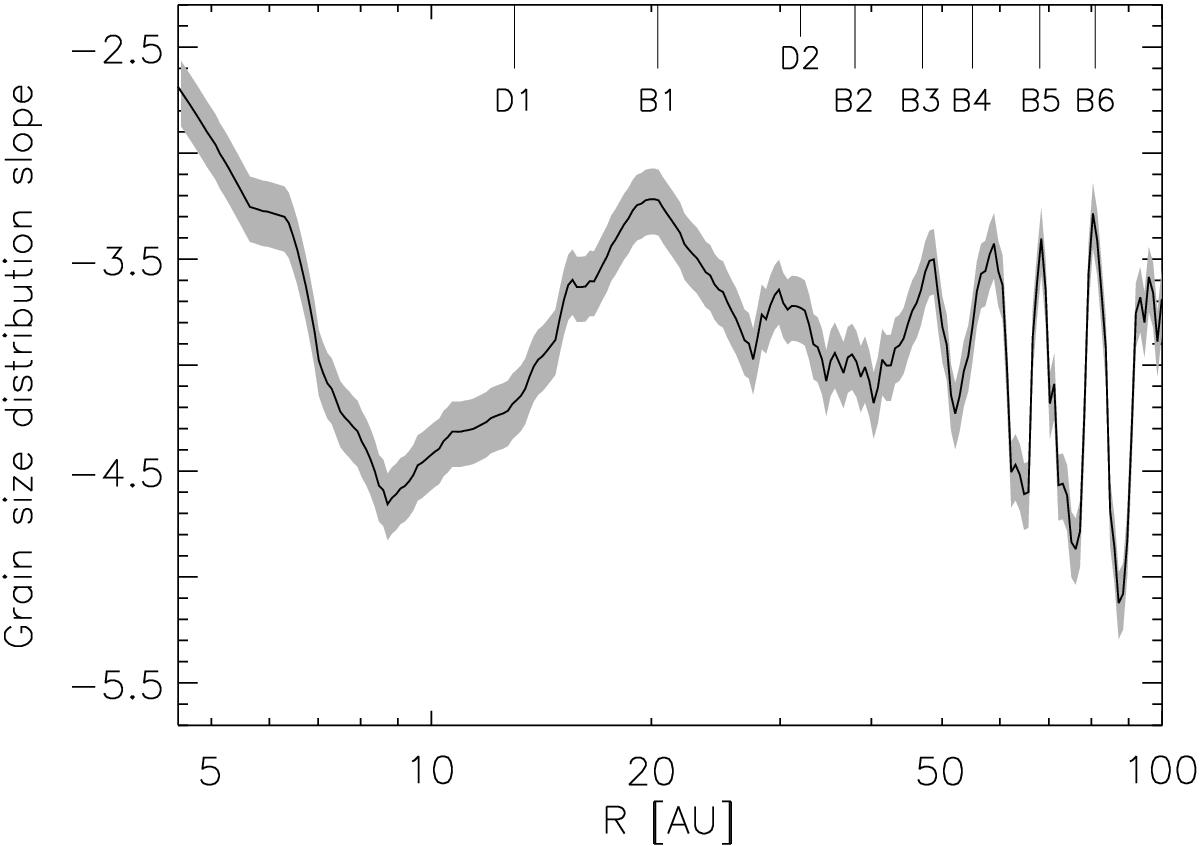
Slope of the local grain size distribution as a function of radius. The black solid line refers to model C, whereas the shaded region shows the results of all models within the confidence interval (see Sect. 5.3).
Current usage metrics show cumulative count of Article Views (full-text article views including HTML views, PDF and ePub downloads, according to the available data) and Abstracts Views on Vision4Press platform.
Data correspond to usage on the plateform after 2015. The current usage metrics is available 48-96 hours after online publication and is updated daily on week days.
Initial download of the metrics may take a while.