Fig. 5
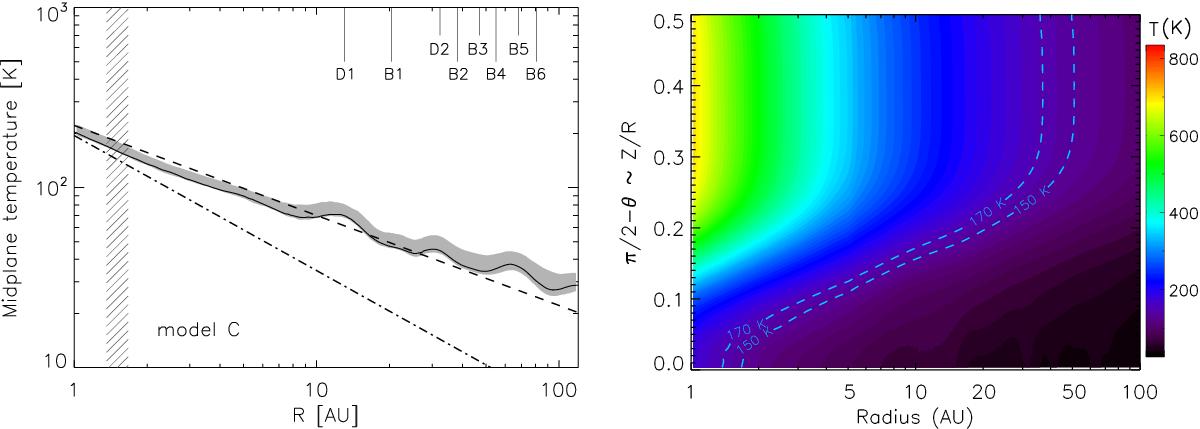
Left panel: temperature distribution in the disk midplane. The black solid line refers to model C, whereas the shaded region shows the results of all models within the confidence interval. The dashed line represents a power-law distribution: Tdust = T0(R/R0)− q with q = 0.5, T0 = 70 K and R0 = 10 AU, which is one of the assumed temperature distributions from Carrasco-González et al. (2016). The dash-dotted line shows the effective temperature distribution of the disk if disk accretion is the only heating source (see Sect. 6.1). The hashed region corresponds to the location of water snow-line (R ~ 1.5 AU) assuming an ice sublimation temperature of 150−170 K. Right panel: the temperature structure as a function of radius R and polar angle θ in spherical coordinates (π/ 2 is the equatorial plane, i.e., the bottom of the figure) for model C. The 150 K and 170 K contours are indicated with dashed lines.
Current usage metrics show cumulative count of Article Views (full-text article views including HTML views, PDF and ePub downloads, according to the available data) and Abstracts Views on Vision4Press platform.
Data correspond to usage on the plateform after 2015. The current usage metrics is available 48-96 hours after online publication and is updated daily on week days.
Initial download of the metrics may take a while.