Fig. 3
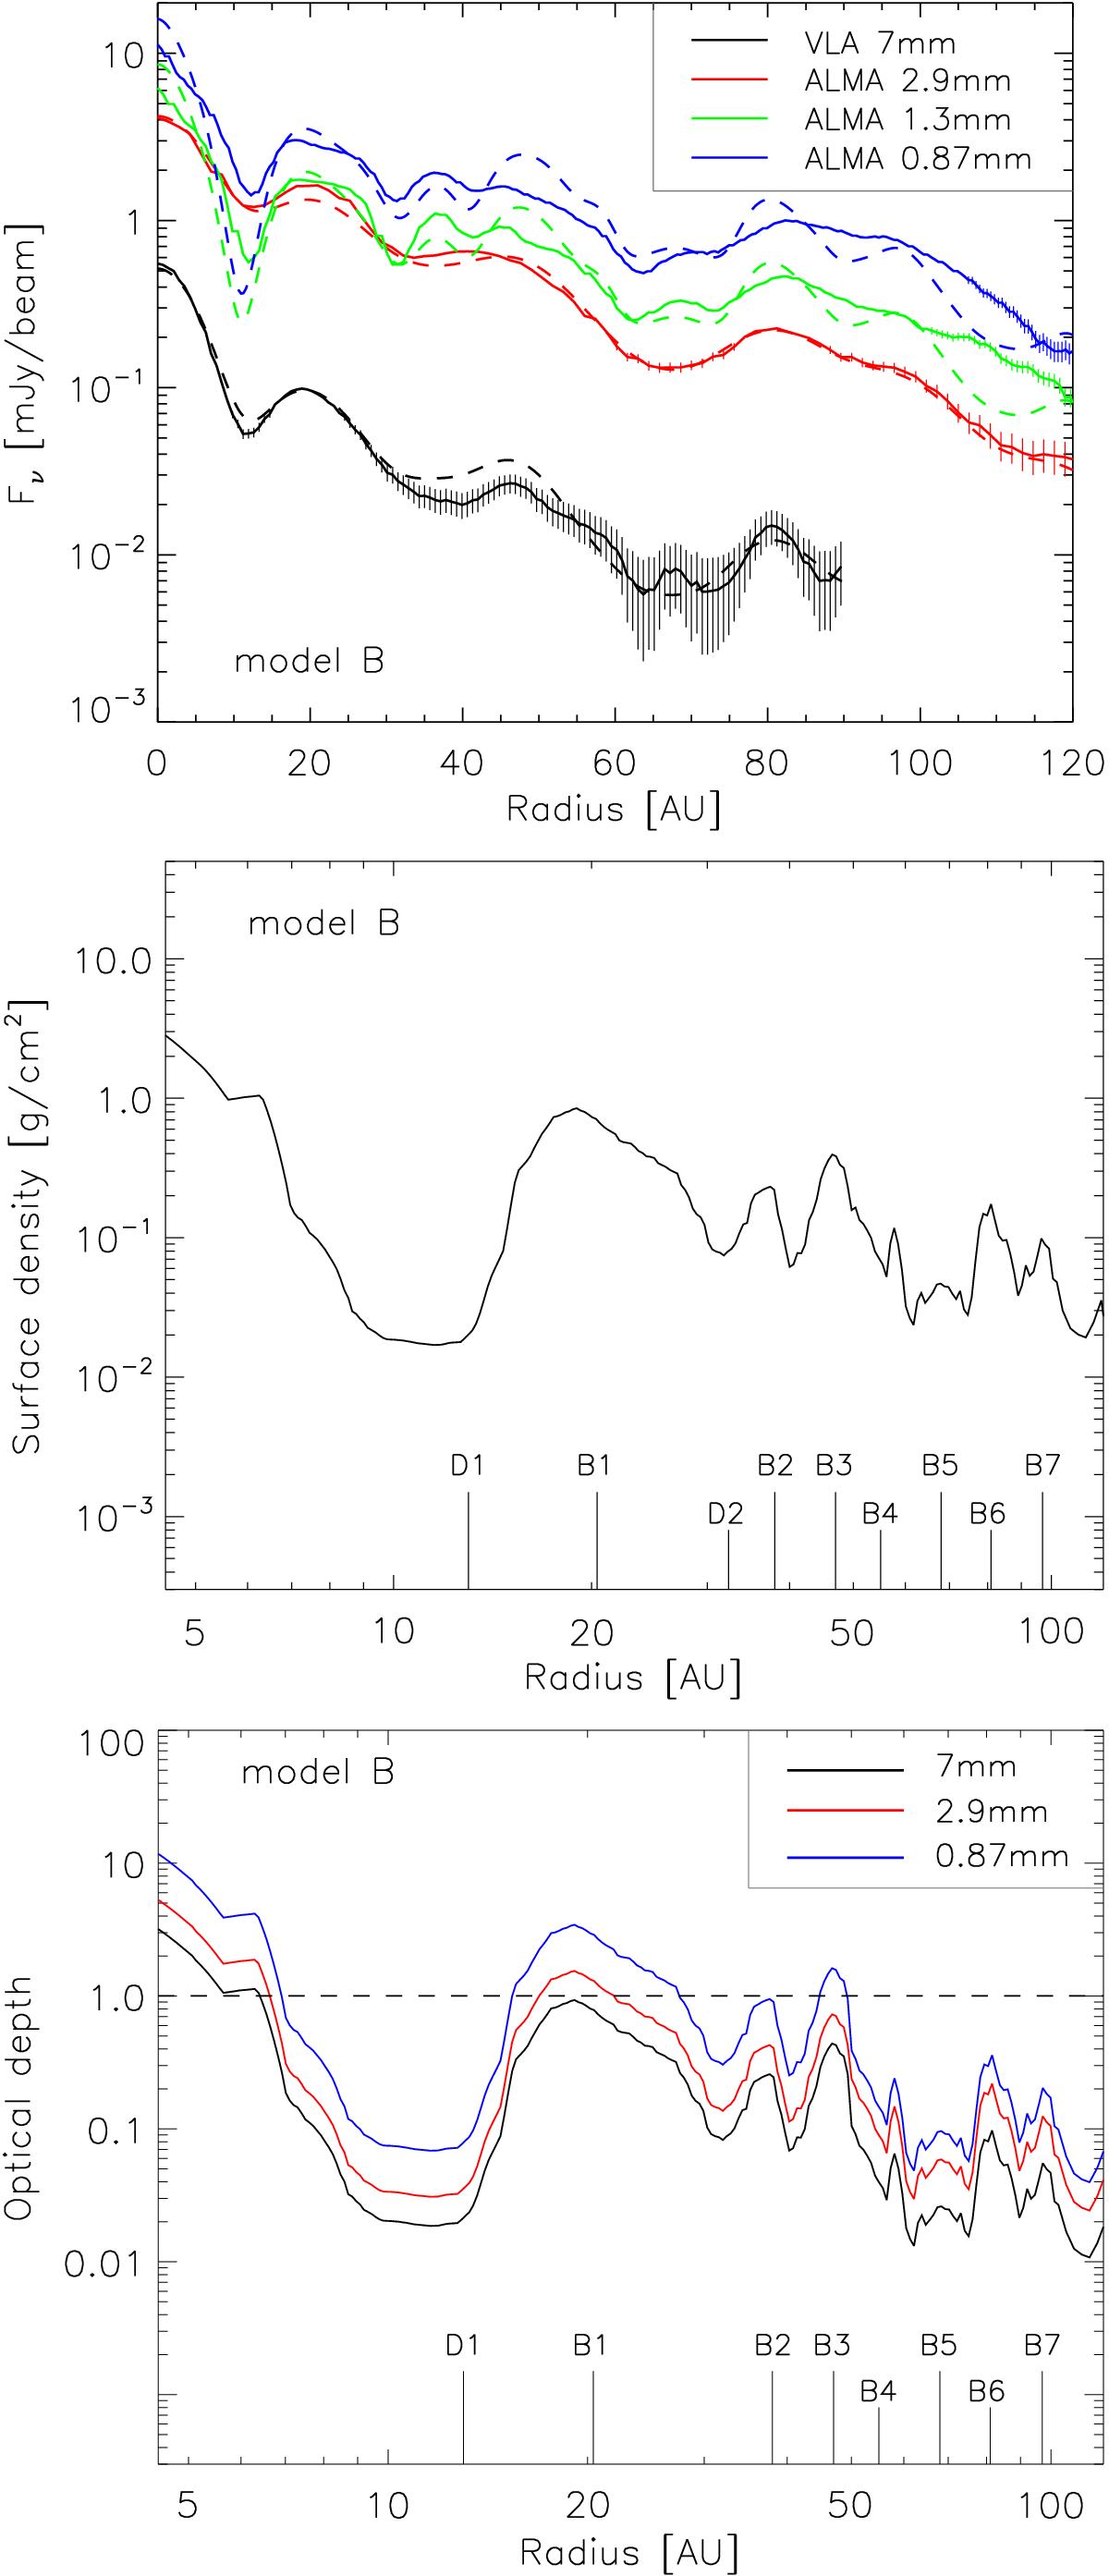
Top panel: observed (solid lines) and synthetic (dashed lines) flux distributions along the major axis of the disk. The results are for model B, in which the inner (< 50 AU) and outer (> 50 AU) disks have different grain size distributions (see Sect. 5.2). For better representation, we only show the error bars of the observations which are larger than 5% of the fluxes. VLA 7 mm data are shown as black, band 3 as red, band 6 as green, and band 7 as blue lines. The VLA data at R> ~ 90 AU are not shown because of a low signal-to-noise ratio. Middle panel: the combined surface density profile of model B. Bottom panel: the vertical optical depth of as a function of radius at 7, 2.9, and 0.87 mm wavelength.
Current usage metrics show cumulative count of Article Views (full-text article views including HTML views, PDF and ePub downloads, according to the available data) and Abstracts Views on Vision4Press platform.
Data correspond to usage on the plateform after 2015. The current usage metrics is available 48-96 hours after online publication and is updated daily on week days.
Initial download of the metrics may take a while.