Fig. 2
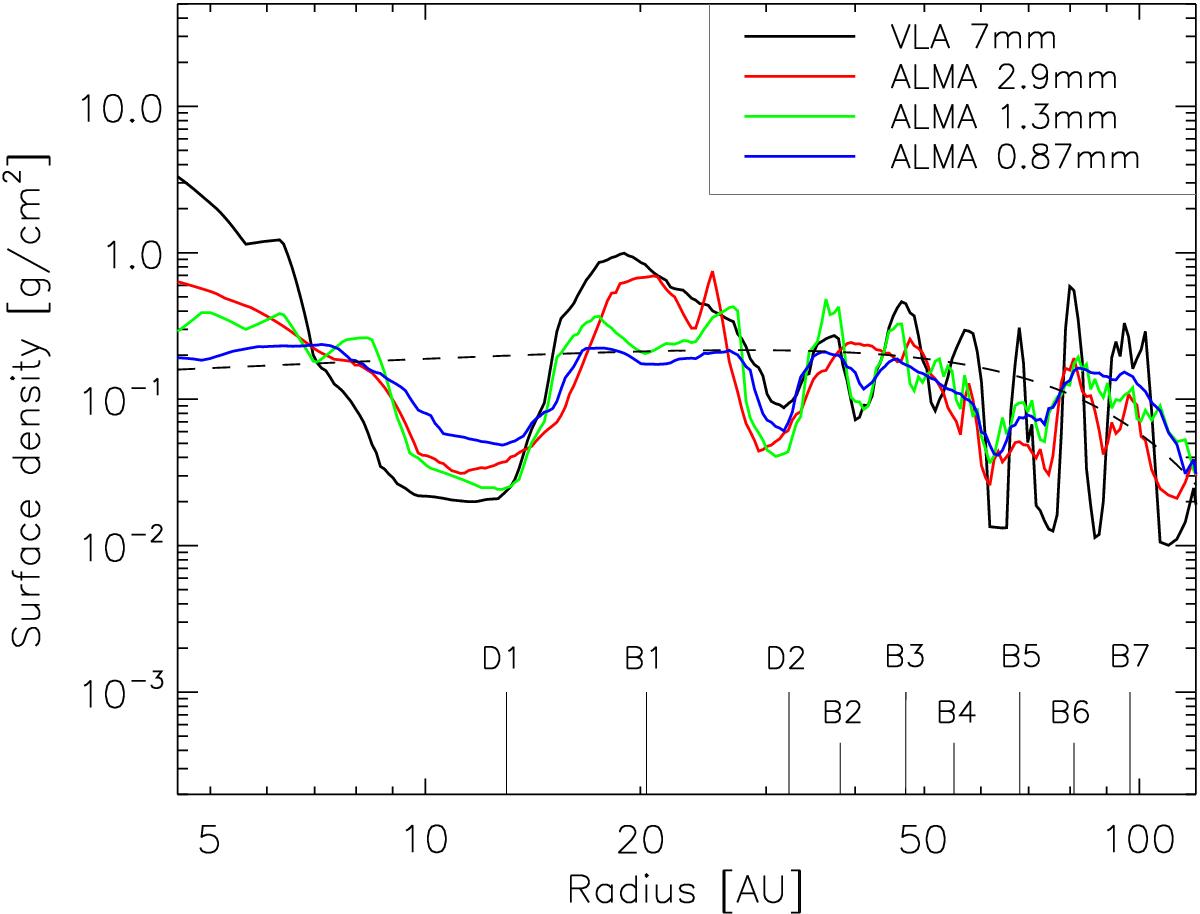
Surface density profiles obtained from fitting the brightness distributions along the disk major axis at each wavelength (see Sect. 3). The dashed line represents a tapered-edge model: Σ(R) ∝ (R/RC)− γ exp [−(R/RC)2−γ] with RC = 78.9 AU and γ = −0.22 from Kwon et al. (2011). Selected gaps and rings identified by ALMA Partnership et al. (2015) are indicated. ΣVLA (7 mm) is shown as black, ΣB3 (2.9 mm) as red, ΣB6 (1.3 mm) as green, and ΣB7 (0.87 mm) as blue lines.
Current usage metrics show cumulative count of Article Views (full-text article views including HTML views, PDF and ePub downloads, according to the available data) and Abstracts Views on Vision4Press platform.
Data correspond to usage on the plateform after 2015. The current usage metrics is available 48-96 hours after online publication and is updated daily on week days.
Initial download of the metrics may take a while.