Fig. 8
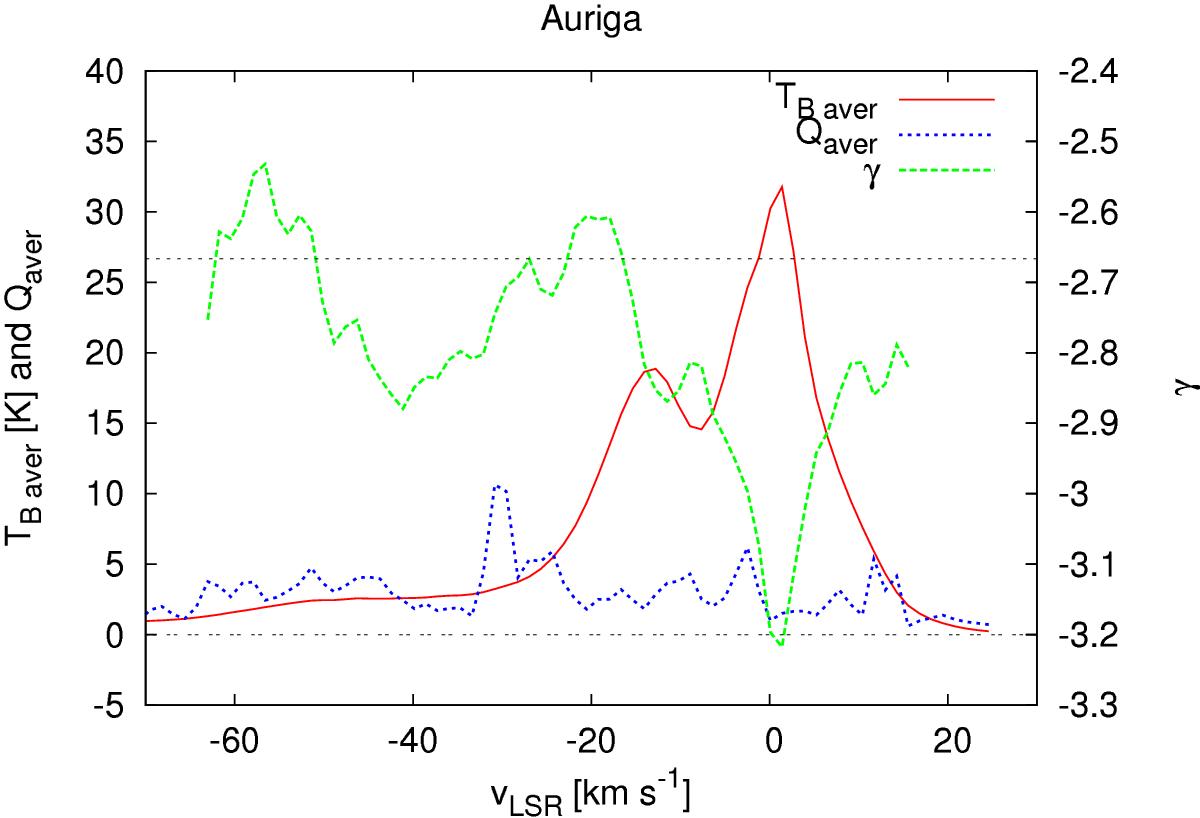
Comparison between the average apodized brightness temperature profile TB aver (red) for the Auriga field, derived average anisotropy factor Qaver for 0.007 <k< 0.07 arcmin-1 (blue), and spectral index γ (green). The upper horizontal black dotted line indicates the Kolmogorov spectral index of γ = −8 / 3, the lower dash-dotted line Qaver = 0.
Current usage metrics show cumulative count of Article Views (full-text article views including HTML views, PDF and ePub downloads, according to the available data) and Abstracts Views on Vision4Press platform.
Data correspond to usage on the plateform after 2015. The current usage metrics is available 48-96 hours after online publication and is updated daily on week days.
Initial download of the metrics may take a while.