Free Access
Fig. B.2
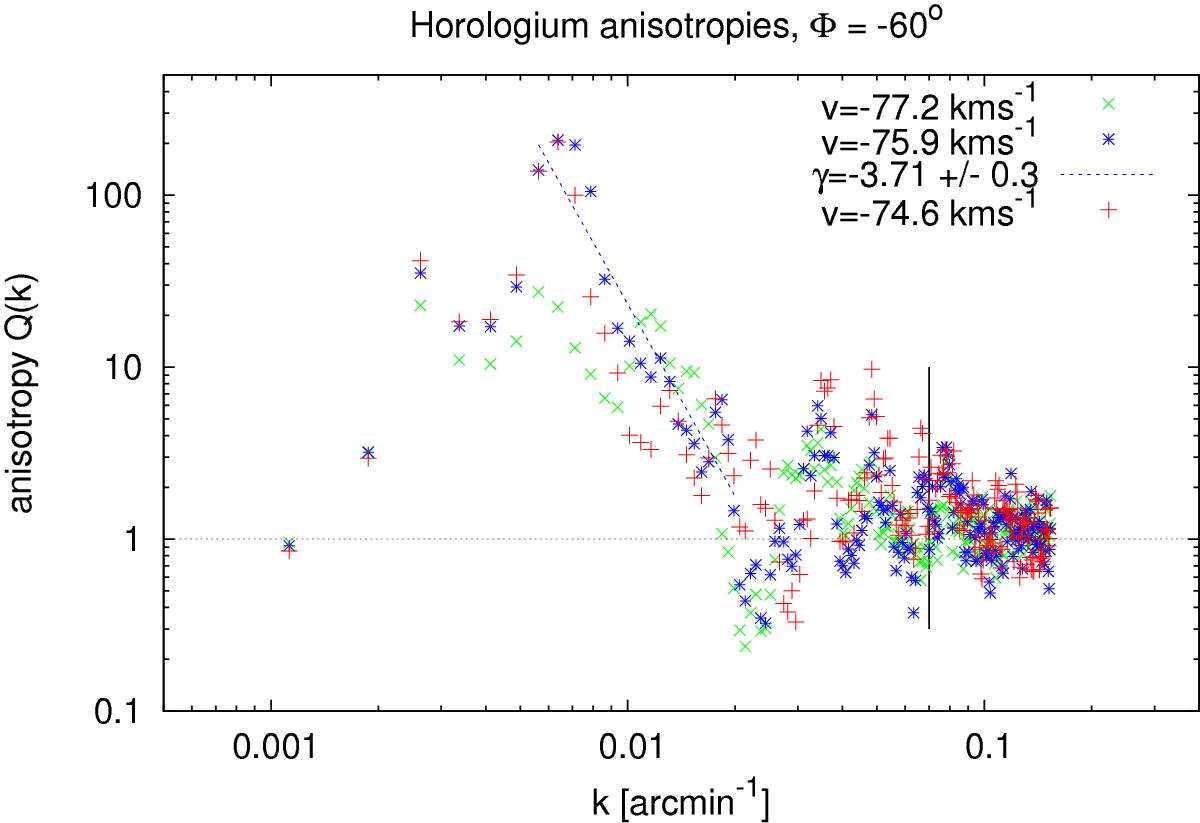
Anisotropies Q(k) in the outer arm at velocities vLSR = −77.2 km s-1 (green), vLSR = −75.9 km s-1 (blue), and vLSR = −74.6 km s-1 (red). The blue line reproduces a fit to 20 data points at vLSR = −75.9 km s-1, tentatively indicating the decay of the strong local anisotropy with Q = 209.
Current usage metrics show cumulative count of Article Views (full-text article views including HTML views, PDF and ePub downloads, according to the available data) and Abstracts Views on Vision4Press platform.
Data correspond to usage on the plateform after 2015. The current usage metrics is available 48-96 hours after online publication and is updated daily on week days.
Initial download of the metrics may take a while.