Fig. A.9
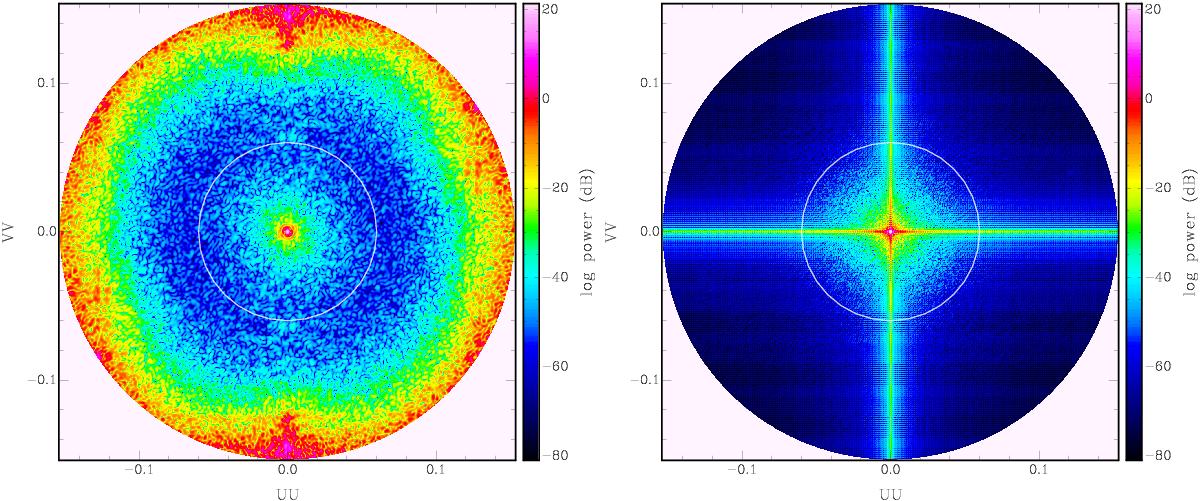
Thick velocity slice power distributions for MBM 16, integrating over −1.1 <vLSR< 15.6 km s-1. Left: apodized distribution, corrected for the beam function. Right: the same data without apodization and beam correction. The scales are logarithmic in dB. The circle indicates the 3σ spatial frequency limit km = 0.06 arcmin-1, corresponding to a linear size of 0.39 pc. Data for higher spatial frequencies are dominated by the instrumental noise.
Current usage metrics show cumulative count of Article Views (full-text article views including HTML views, PDF and ePub downloads, according to the available data) and Abstracts Views on Vision4Press platform.
Data correspond to usage on the plateform after 2015. The current usage metrics is available 48-96 hours after online publication and is updated daily on week days.
Initial download of the metrics may take a while.