Fig. A.8
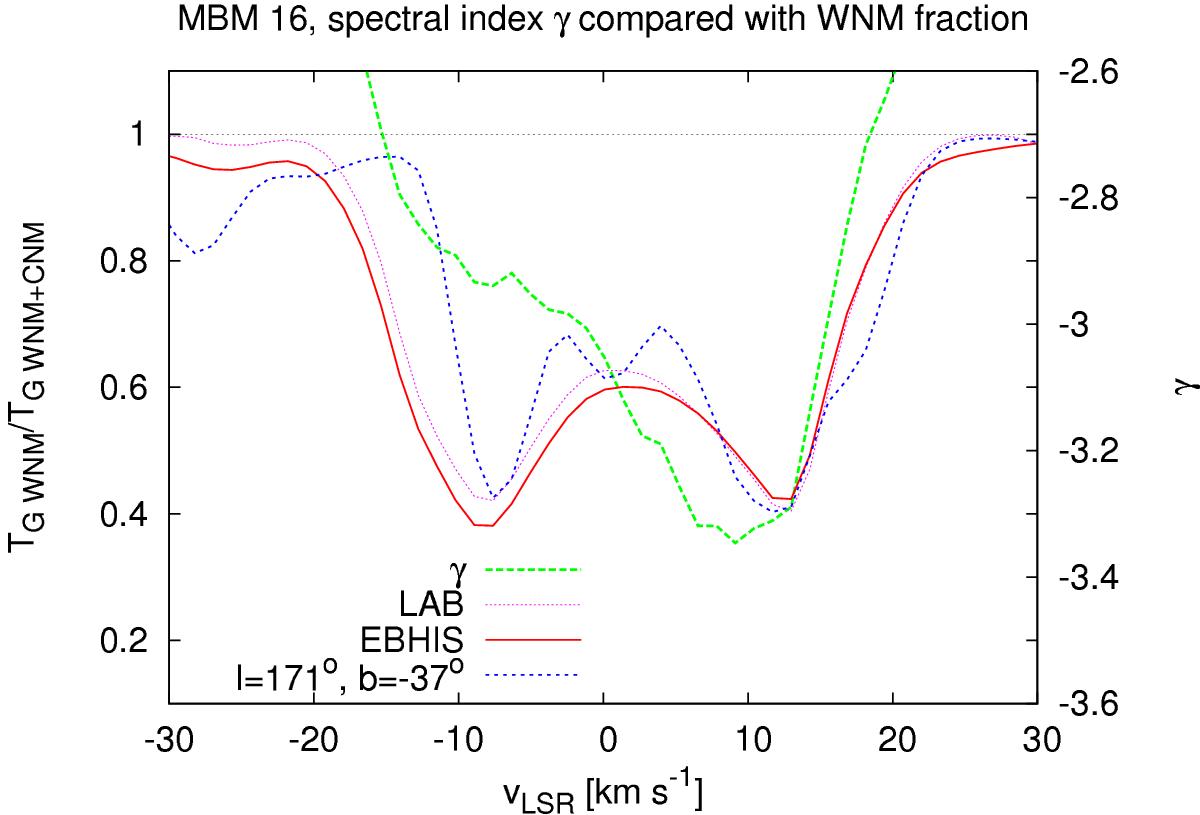
Spectral index γ(vLSR) (green) compared with the WNM fraction TWNM(vLSR) /TWNM + CNM(vLSR) derived from LAB (pink) and EBHIS Gaussians (red) for the MBM 16 field. An upper limit for the Doppler temperature of the CNM of TD< 1100 K, corresponding to a turbulent CNM Mach number of MT = 3.7 was applied. We display also with a blue dotted line the WNM fraction TWNM(vLSR) /TWNM + CNM(vLSR) derived from EBHIS, using TD< 1100 K, for a central position l = 171°,b = −37° within a radius of 1.̊5. This corresponds to the region with CO emission observed by LaRosa et al. (1999, Fig. 1).
Current usage metrics show cumulative count of Article Views (full-text article views including HTML views, PDF and ePub downloads, according to the available data) and Abstracts Views on Vision4Press platform.
Data correspond to usage on the plateform after 2015. The current usage metrics is available 48-96 hours after online publication and is updated daily on week days.
Initial download of the metrics may take a while.