Fig. A.5
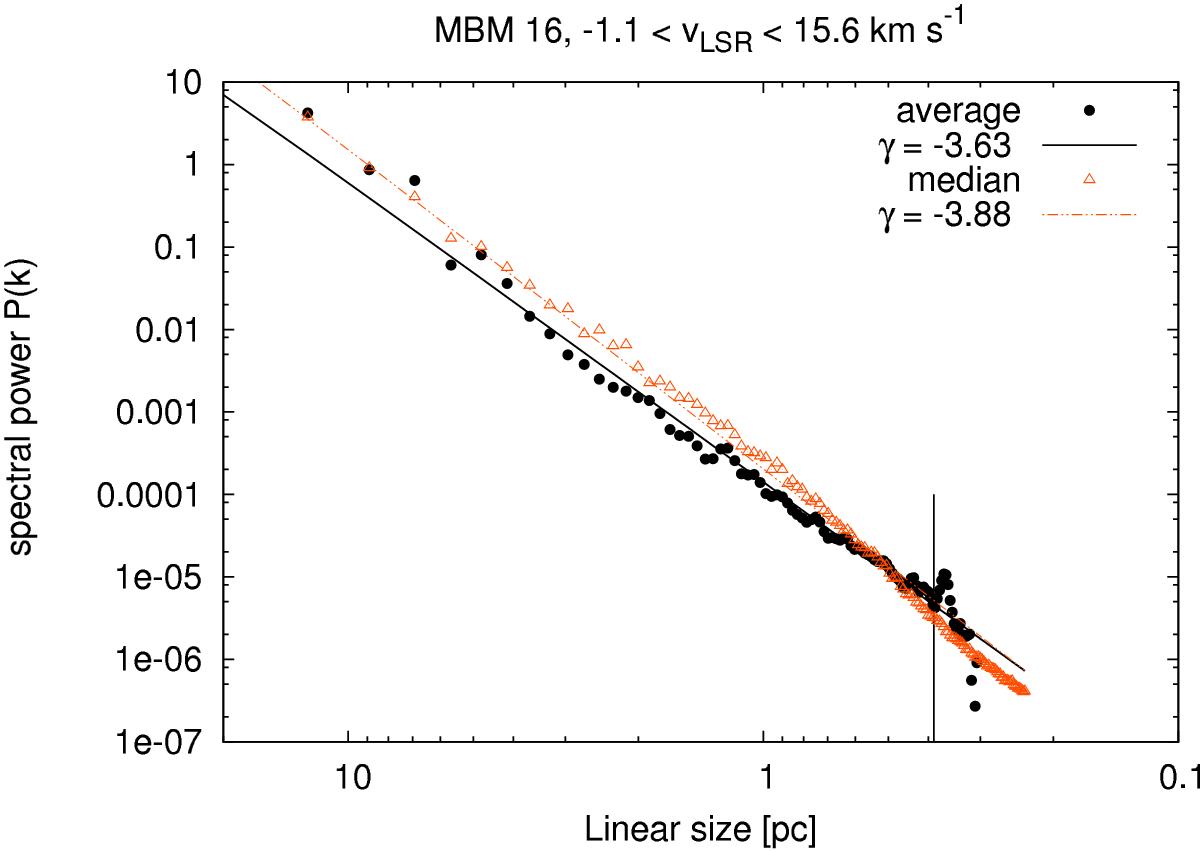
Unnormalized thick velocity slice power spectra for MBM 16, integrating over −1.1 <vLSR< 15.6 km s-1 and spectral indices from least squares fits. High spatial frequency limits km< 0.06 arcmin-1, corresponding to a linear size of 0.39 pc were applied and are indicated by the vertical black line. Black dots represent data derived after apodization, beam correction, and noise subtraction. In this case we fit γ = −3.63 ± 0.04. The red triangles show results obtained without apodization and beam correction by fitting the median power distribution. Here we fit γ = −3.88 ± 0.04.
Current usage metrics show cumulative count of Article Views (full-text article views including HTML views, PDF and ePub downloads, according to the available data) and Abstracts Views on Vision4Press platform.
Data correspond to usage on the plateform after 2015. The current usage metrics is available 48-96 hours after online publication and is updated daily on week days.
Initial download of the metrics may take a while.