Fig. A.4
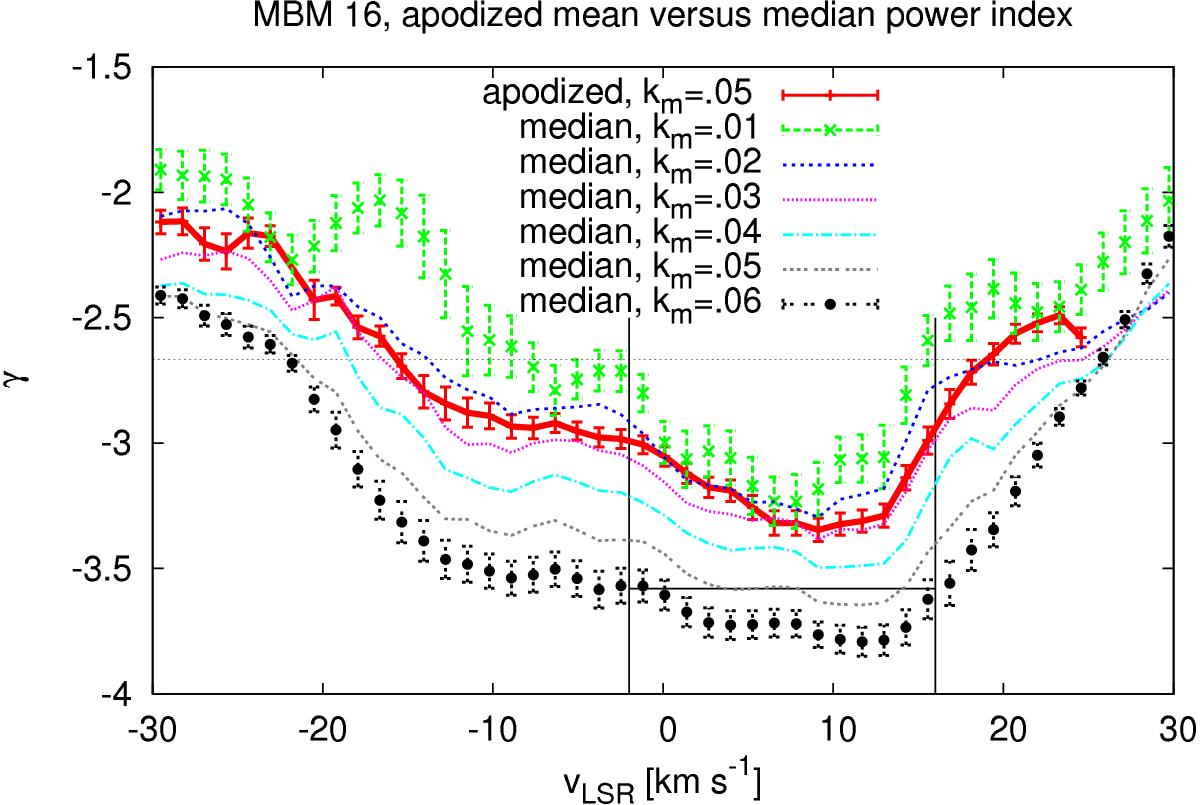
The thick red line represents results obtained after apodization, beam correction, and noise subtraction. The other graphs show results obtained without apodization by fitting the median power distribution. km is in each case the upper limit for the spatial frequencies used for the fit. Error bars are given in three cases to provide an impression of formal uncertainties of the least square fits. The horizontal black dotted line represents the expected Kolmogorov index γ = −8 / 3. The vertical solid black lines bracket the velocity range analyzed by Pingel et al. (2013), the horizontal solid black line gives the weighted average slope γ = −3.58 ± 0.09 obtained by them for this velocity range.
Current usage metrics show cumulative count of Article Views (full-text article views including HTML views, PDF and ePub downloads, according to the available data) and Abstracts Views on Vision4Press platform.
Data correspond to usage on the plateform after 2015. The current usage metrics is available 48-96 hours after online publication and is updated daily on week days.
Initial download of the metrics may take a while.