Fig. A.3
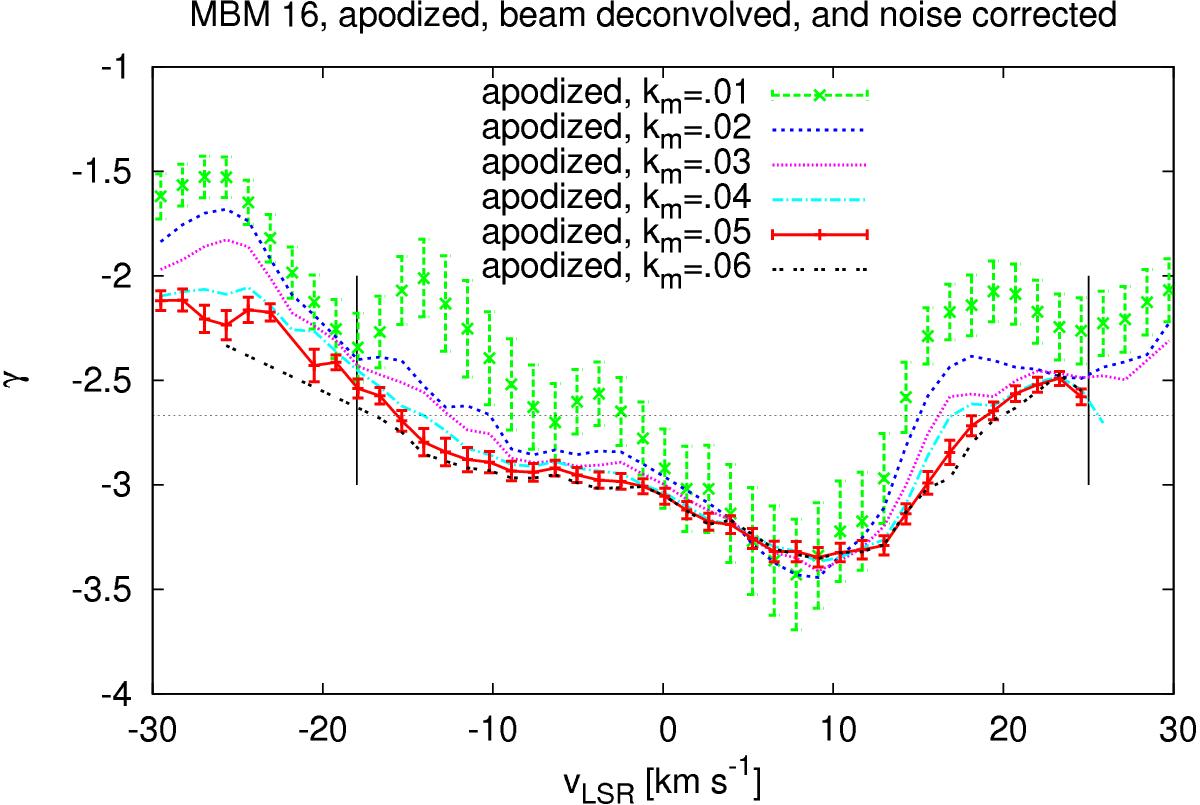
Comparison of results according to the method proposed in Paper I (using apodization, beam correction, and noise subtraction) obtained from fits with different upper limits 0.01 <km < 0.06 arcmin-1 in spatial frequency. Error bars are given in two cases to provide an impression of formal uncertainties of the least square fits. The horizontal black dotted line indicates the Kolmogorov spectral index γ = −8 / 3, the solid vertical lines bracket the velocity range with average brightness temperatures TB aver > 0.5 K.
Current usage metrics show cumulative count of Article Views (full-text article views including HTML views, PDF and ePub downloads, according to the available data) and Abstracts Views on Vision4Press platform.
Data correspond to usage on the plateform after 2015. The current usage metrics is available 48-96 hours after online publication and is updated daily on week days.
Initial download of the metrics may take a while.