Fig. 23
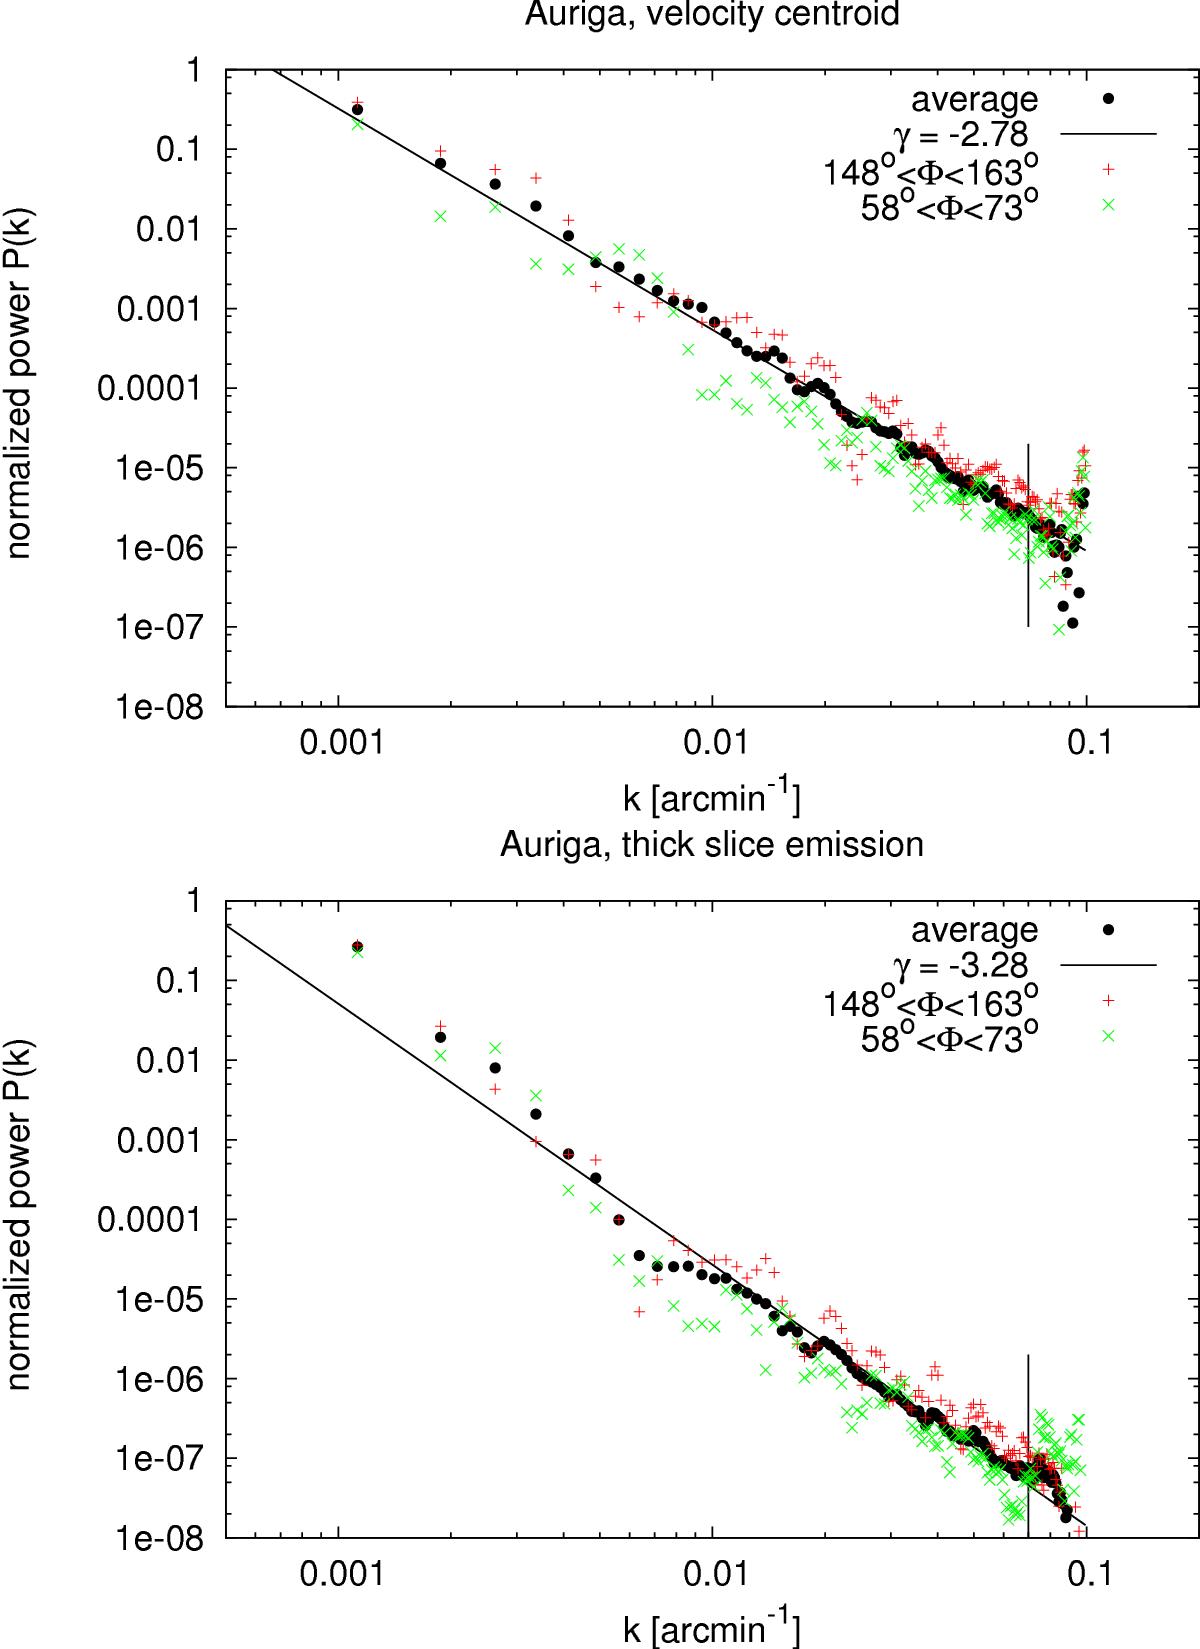
Power spectrum (black dots) calculated for the velocity centroid (top) and the thick slice emission (bottom) over the velocity range −10.2 < vLSR < 11.7 km s-1. For the velocity centroid a power law with γ = −2.78 ± 0.03 was fit and respectively γ = −3.28 ± 0.04 for the average emission (black lines), in both cases for k< 0.07 arcmin-1 (vertical line). In addition the power spectra for 148° < Φ < 163° (red) and 58° < Φ < 73° (green) are plotted. The average anisotropy factor for 0.007 < k < 0.07 arcmin-1 is Qaver = 3.2 for the centroid and Qaver = 2.6 for the average emission.
Current usage metrics show cumulative count of Article Views (full-text article views including HTML views, PDF and ePub downloads, according to the available data) and Abstracts Views on Vision4Press platform.
Data correspond to usage on the plateform after 2015. The current usage metrics is available 48-96 hours after online publication and is updated daily on week days.
Initial download of the metrics may take a while.