Fig. 5
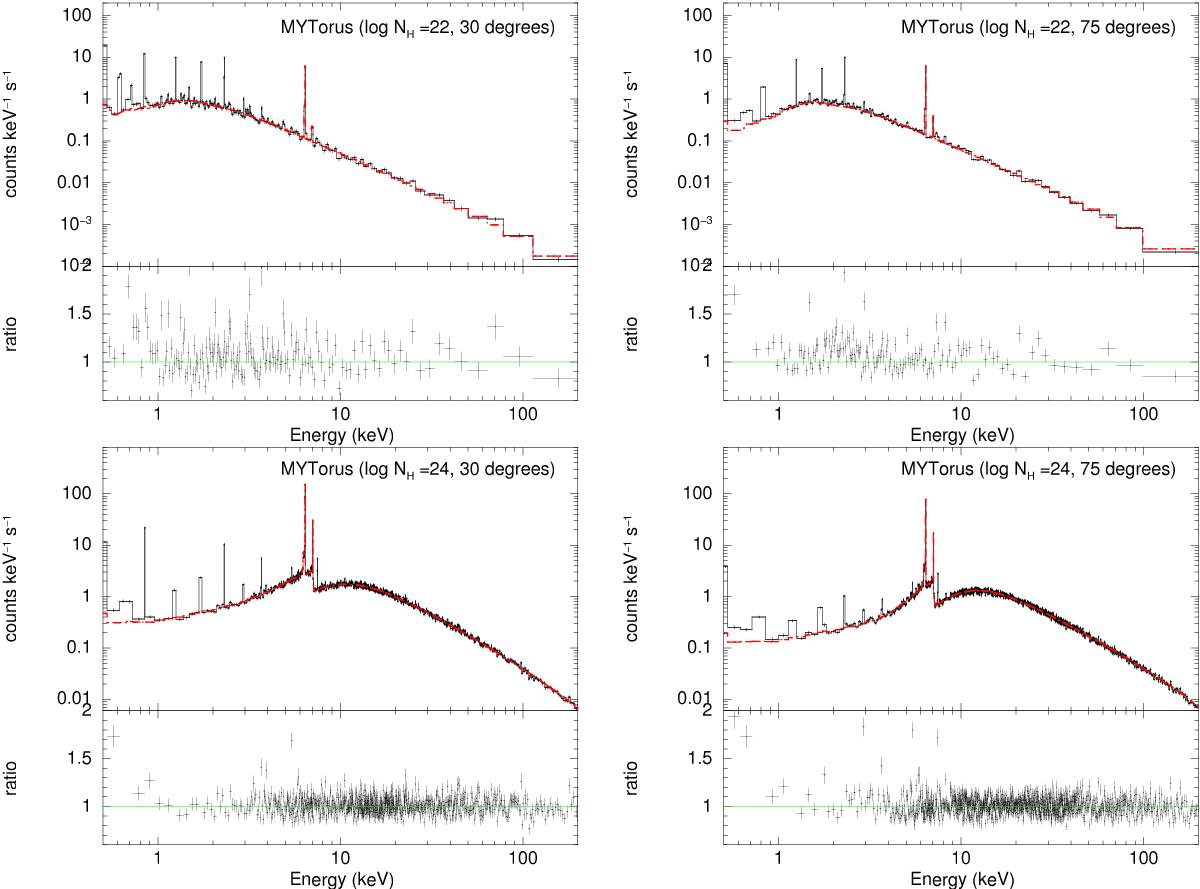
Comparison between MYTorus and our simulations assuming the geometry of Fig. 4 for two viewing angles and two equatorial column densities. For both models we show only reprocessed radiation. Top: i = 30 deg; bottom: i = 75 deg. Left: NH,eq = 1022 cm-2; right: NH,eq = 1024 cm-2. In each panel, the top subplot shows the MYTorus model (black line) and our simulations (crosses); the bottom subplot shows the ratio between our simulations and the MYTorus model. In all cases, the primary continuum is defined as a power law between 1 and 500 keV with a photon index Γ = 1.9. Spectra are averaged over 2 deg in inclination. 1010 photons were generated.
Current usage metrics show cumulative count of Article Views (full-text article views including HTML views, PDF and ePub downloads, according to the available data) and Abstracts Views on Vision4Press platform.
Data correspond to usage on the plateform after 2015. The current usage metrics is available 48-96 hours after online publication and is updated daily on week days.
Initial download of the metrics may take a while.