Fig. 2
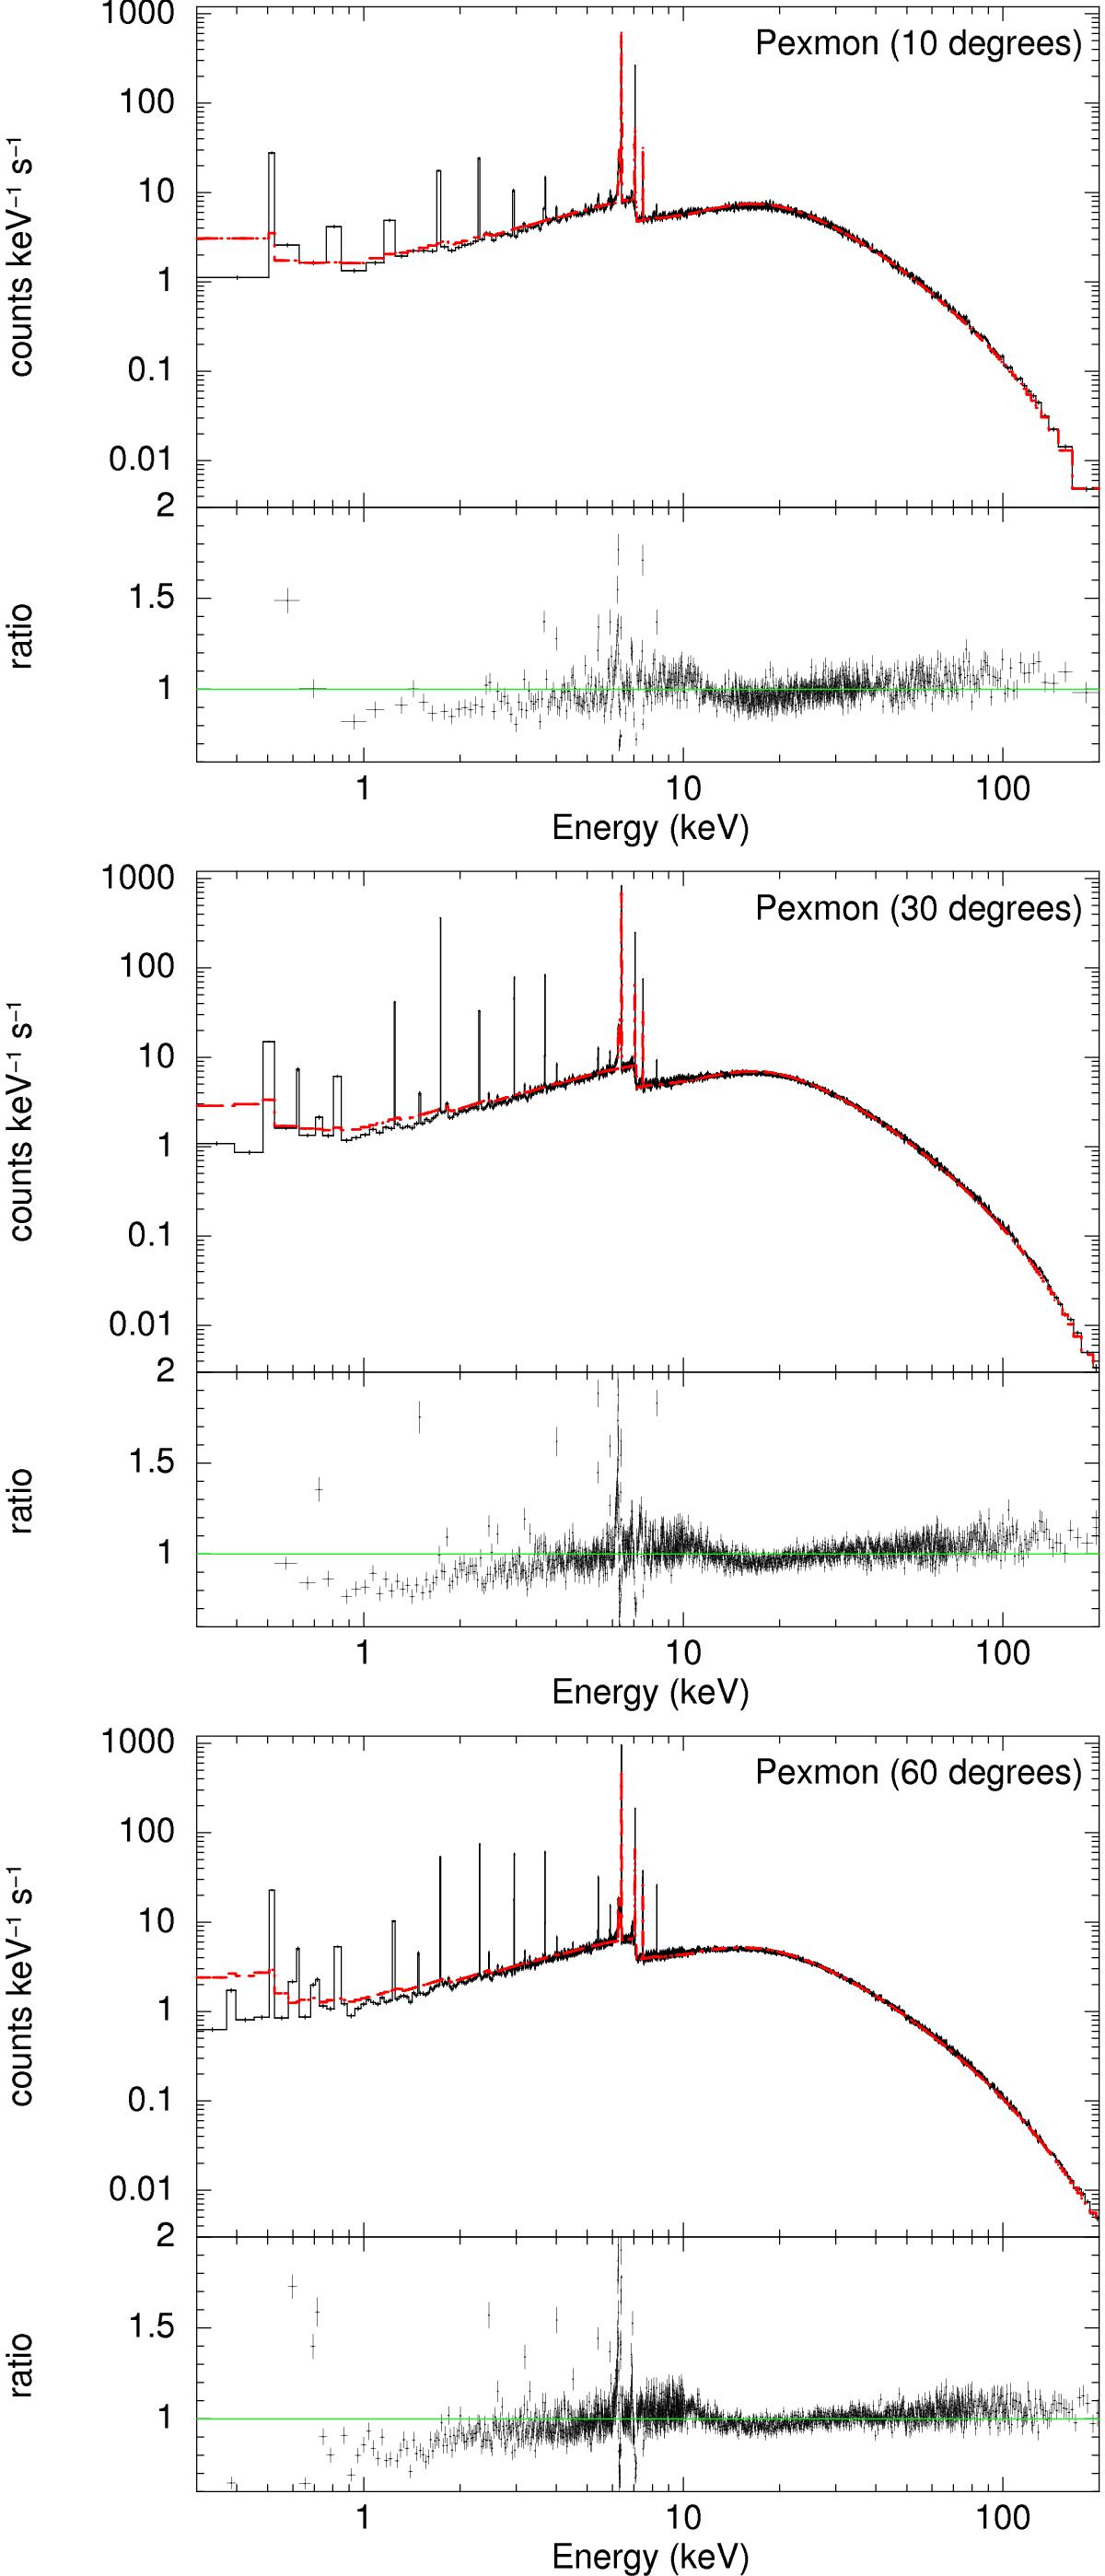
Comparison between pexmon and our RefleX simulations assuming the geometry of Fig. 1 for three viewing angles. Top: i = 10 deg; middle: i = 30 deg; and bottom: i = 60 deg. In each panel, the top subplot shows the pexmon model (solid line) and the RefleX simulation (crosses); the bottom subplot shows the ratio between our simulations and the pexmon model. In all cases, the primary continuum is defined as a cutoff power law starting at 1 keV with an index Γ = 1.5 and a cutoff energy at 100 keV. Spectra are averaged over 2 deg in inclination. 1010 photons were generated.
Current usage metrics show cumulative count of Article Views (full-text article views including HTML views, PDF and ePub downloads, according to the available data) and Abstracts Views on Vision4Press platform.
Data correspond to usage on the plateform after 2015. The current usage metrics is available 48-96 hours after online publication and is updated daily on week days.
Initial download of the metrics may take a while.