Fig. 12
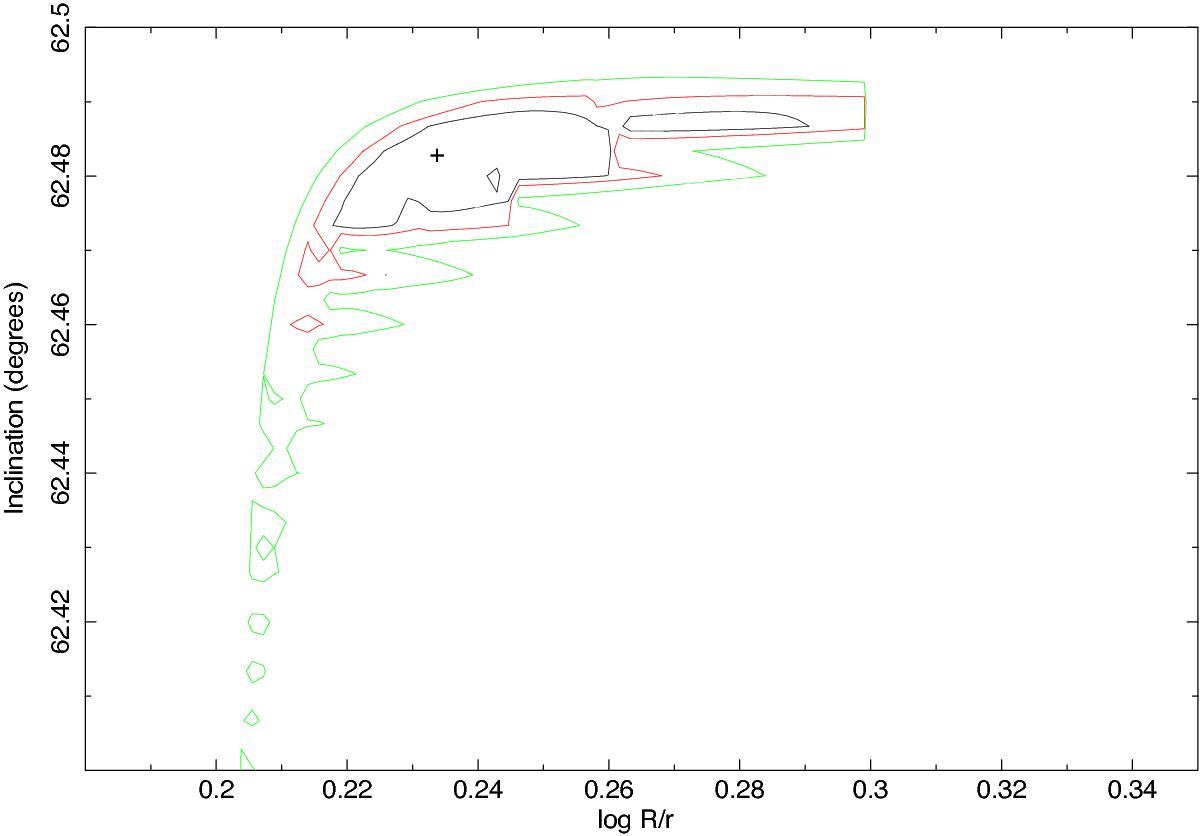
Contour plot of the inclination angle versus the ratio of the major to minor radius of the torus for the fit to the XMM-Newton and NuSTAR spectrum of NGC 424 carried out with the non-atomic RXTorus model. The cross indicates the best fit. The black, red and green lines show the Δχ2 = 2, 3, 4.61 and 9.21 contours respectively (corresponding to 68, 90 and 99% respectively)
Current usage metrics show cumulative count of Article Views (full-text article views including HTML views, PDF and ePub downloads, according to the available data) and Abstracts Views on Vision4Press platform.
Data correspond to usage on the plateform after 2015. The current usage metrics is available 48-96 hours after online publication and is updated daily on week days.
Initial download of the metrics may take a while.