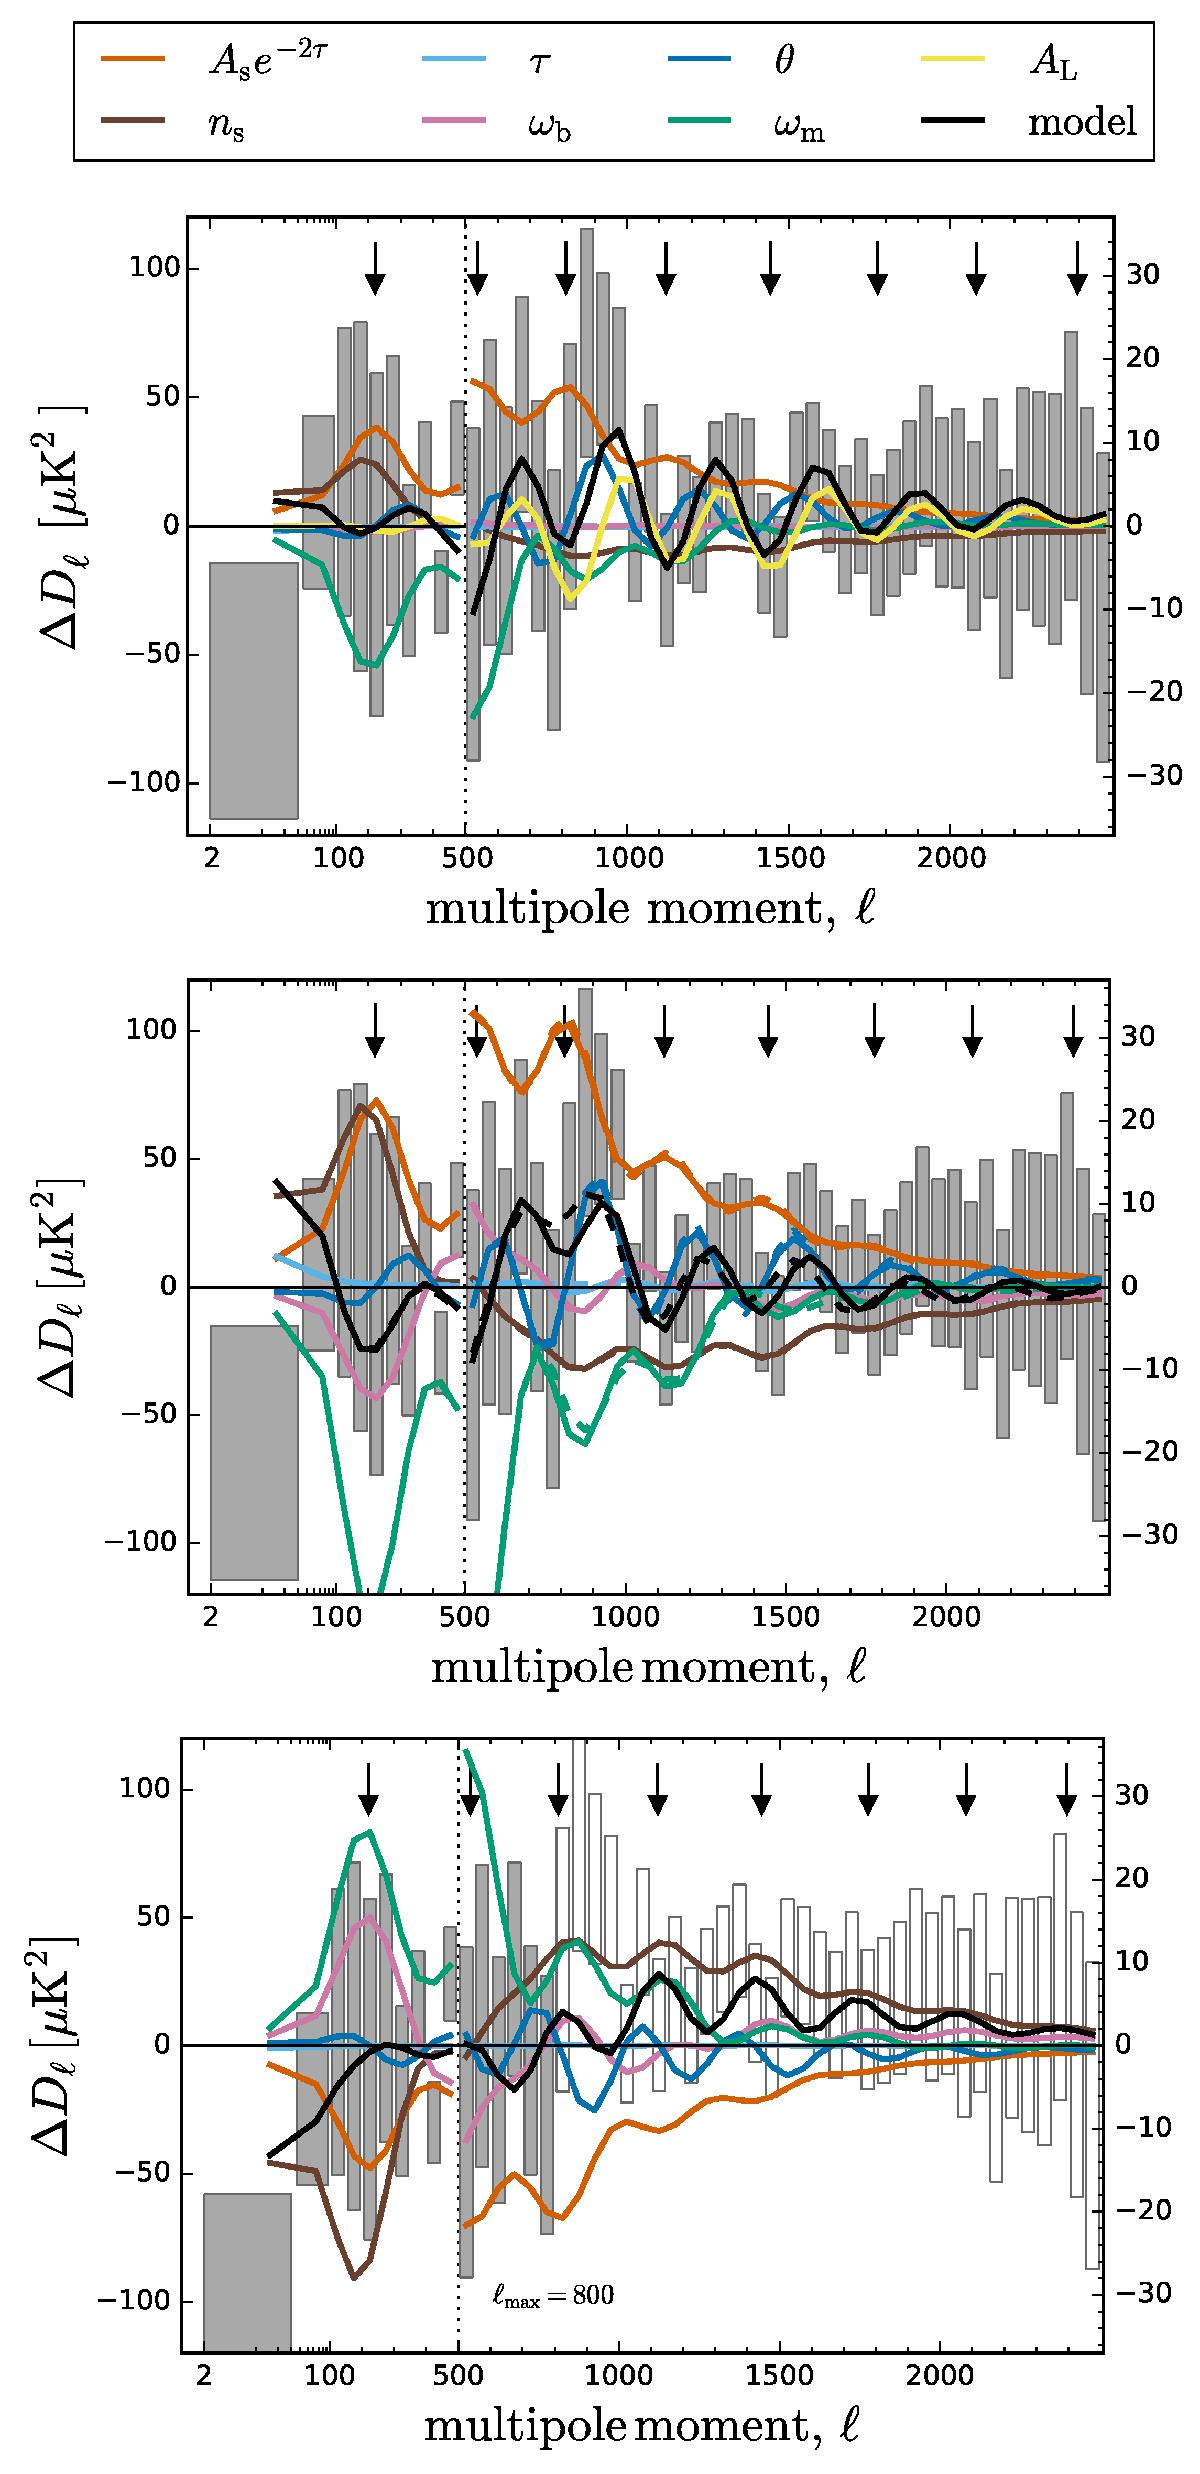
Fig. 8

Power spectrum residuals for a few additional cases, in the same format as Fig. 7. We note that for the bottom panel, the fiducial model is the best-fit from 30 <ℓ < 800, as opposed to from ℓ < 800, as is the case in Fig. 7 and in the top two panels of this figure. In all cases the black line is the best-fit ΛCDM model in the range indicated by the shaded data boxes. The coloured lines are the linear responses to the shifts in parameters between these two best-fit solutions. Top: same as panel 5a of Fig. 7, but with an additional free parameter, AL, shown in yellow. This added degree of freedom tracks reasonably well the oscillatory residuals, leaving smaller shifts for the other parameters and a reduced low-ℓ deficit. Middle: same as panel 5a of Fig. 7, but with dashed lines showing the responses with the gravitational potential fixed. Bottom: the way in which the best-fit model from 30 <ℓ < 800 is “thrown off” by inclusion of ℓ < 30 data. We note that although visually the ℓ> 800 data appears to be a better fit with ℓ < 30, the χ2 is worse by Δχ2 = 3.2.
Current usage metrics show cumulative count of Article Views (full-text article views including HTML views, PDF and ePub downloads, according to the available data) and Abstracts Views on Vision4Press platform.
Data correspond to usage on the plateform after 2015. The current usage metrics is available 48-96 hours after online publication and is updated daily on week days.
Initial download of the metrics may take a while.


