Fig. 4
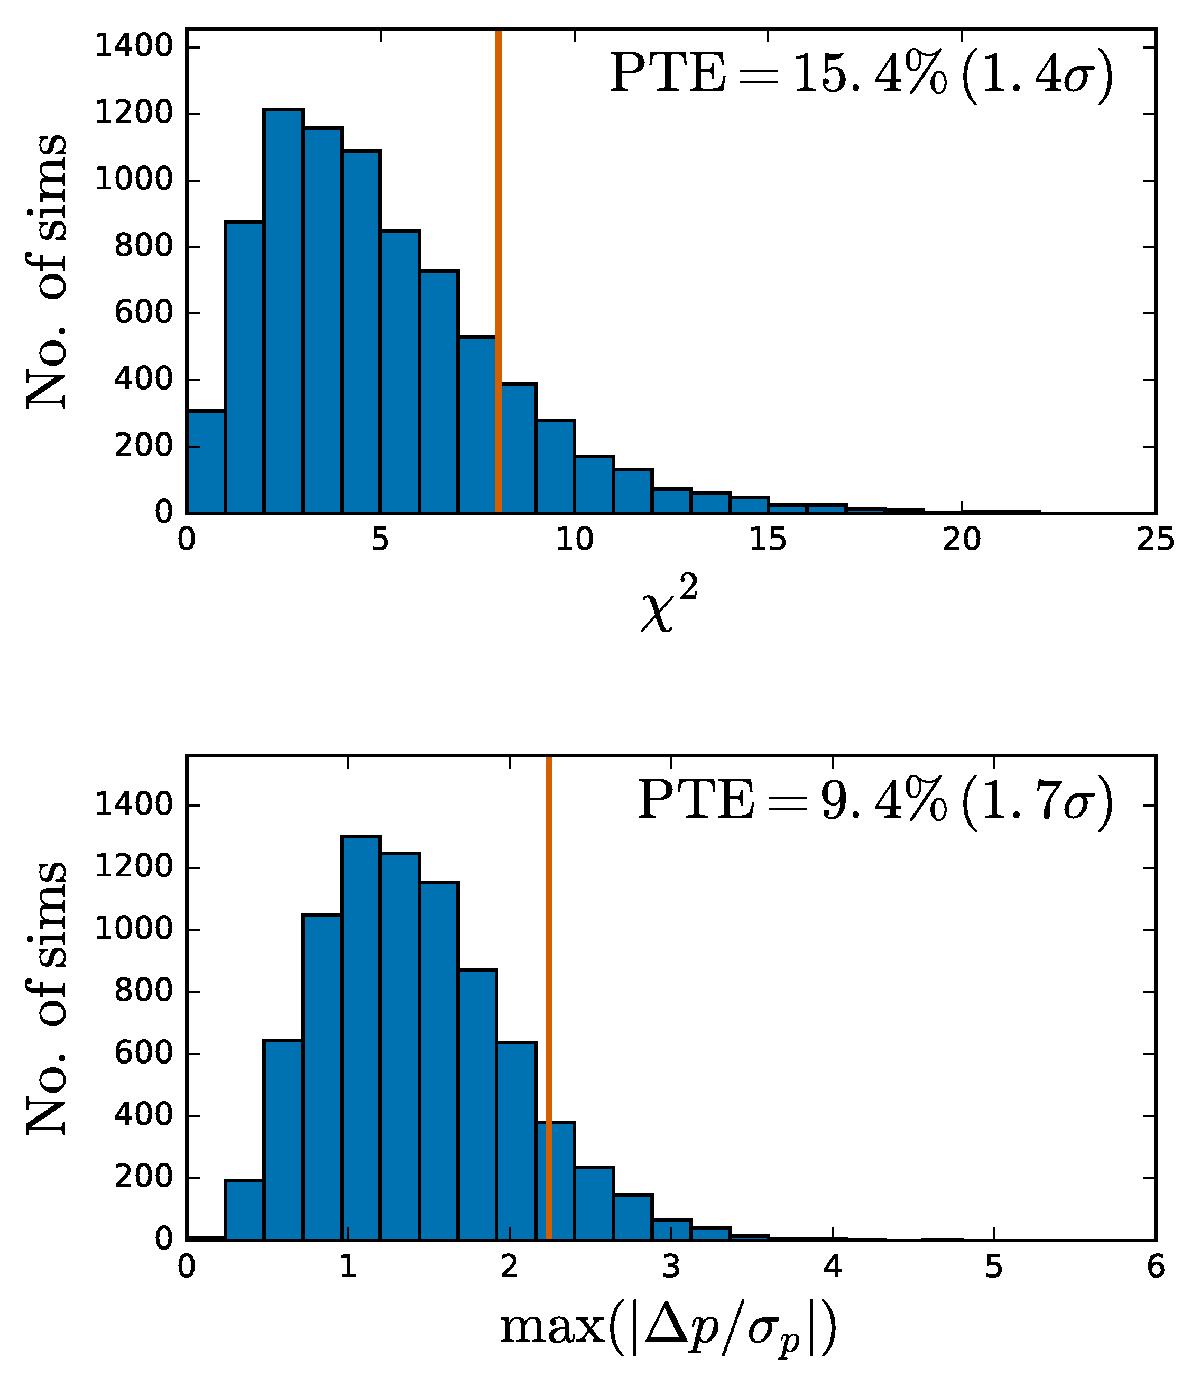
Distribution of two different statistics computed on the simulations (blue histogram) and on the data (orange line). The first is the χ2 statistic, where we compute χ2 for the change in parameters between ℓ < 800 and ℓ < 2500, with respect to the covariance of the expected shifts. The second is a “biggest outlier” statistic, where we search for the parameter with the largest change, in units of the standard deviation of the simulated shifts. We give the probability to exceed (PTE) on each panel. For both statistics, we find that the observed shifts are largely consistent with expectations from simulations.
Current usage metrics show cumulative count of Article Views (full-text article views including HTML views, PDF and ePub downloads, according to the available data) and Abstracts Views on Vision4Press platform.
Data correspond to usage on the plateform after 2015. The current usage metrics is available 48-96 hours after online publication and is updated daily on week days.
Initial download of the metrics may take a while.