Fig. 2
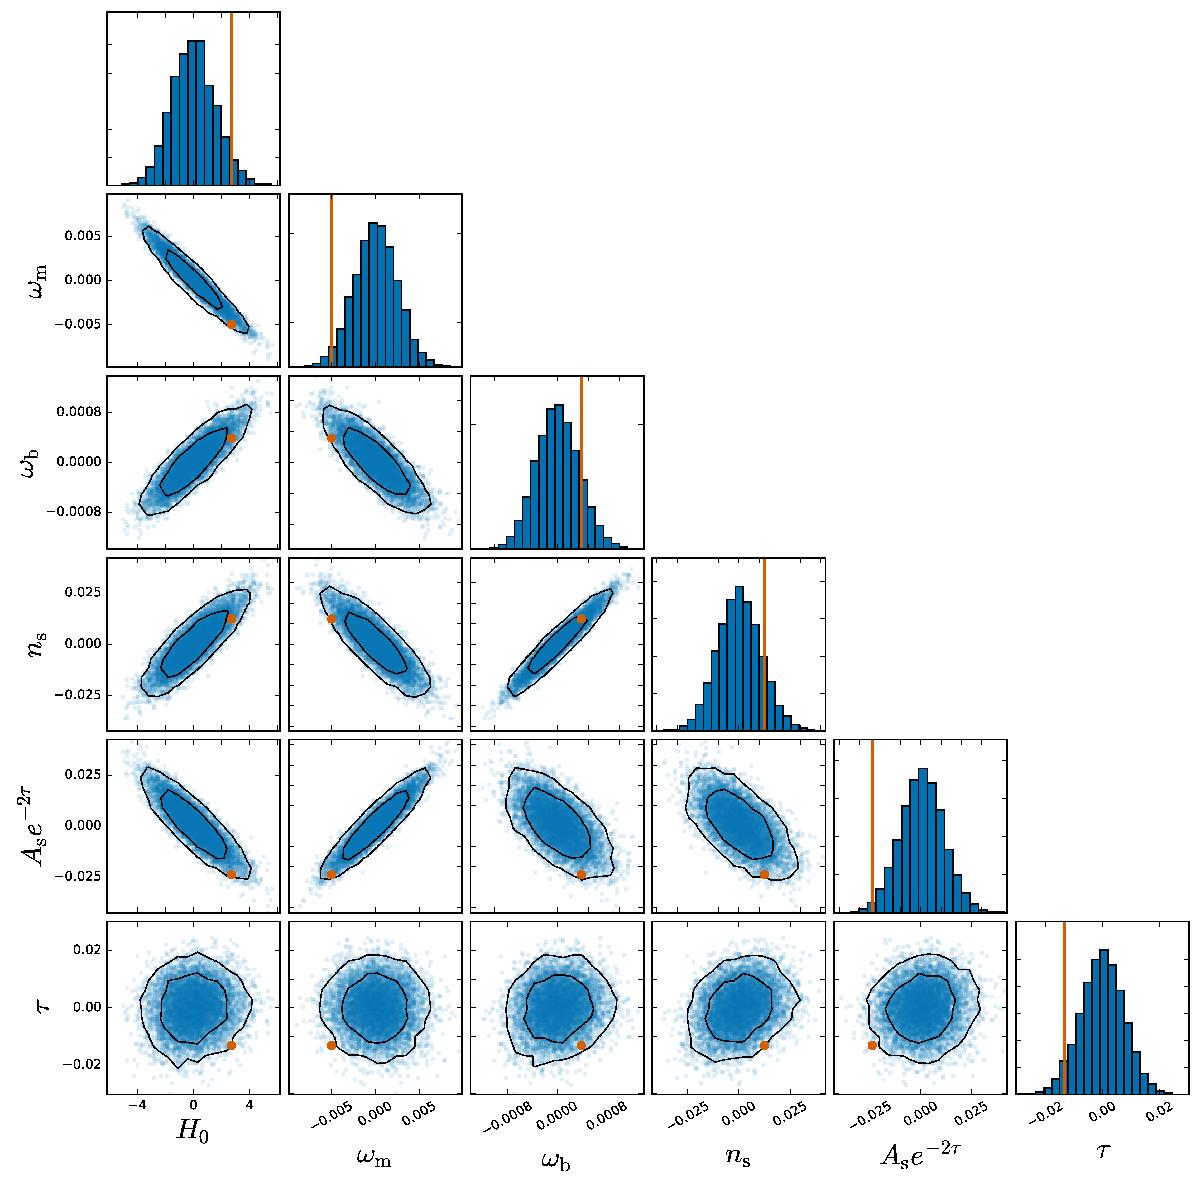
Differences in best-fit parameters between ℓ < 800 and ℓ < 2500 as compared to expectations from a suite of simulations. The cloud of blue points and the histograms are the distribution from simulations (discussed in Sect. 3), while the orange points and lines are the shifts found in the data. Although the shifts may appear to be generally large for this particular choice of parameter set, it is important to realise that this is not an orthogonal basis, and that there are strong correlations among parameters; when this is taken into account, the overall significance of these shifts is 1.4σ, and the significance of the biggest outlier (Ase− 2τ), after accounting for look-elsewhere effects, is 1.7σ. Figure 3 shows these same shifts in a more orthogonal basis that makes judging these significance levels easier by eye. Choosing a different multipole at which to split the data, or comparing low ℓs versus high ℓs alone, does not change this qualitative level of agreement. We note that the parameter mode discussed in Sect. 3.3 is not projected out here, since it would correspond to moving any data point by less than the width of the point itself.
Current usage metrics show cumulative count of Article Views (full-text article views including HTML views, PDF and ePub downloads, according to the available data) and Abstracts Views on Vision4Press platform.
Data correspond to usage on the plateform after 2015. The current usage metrics is available 48-96 hours after online publication and is updated daily on week days.
Initial download of the metrics may take a while.