Fig. B.1
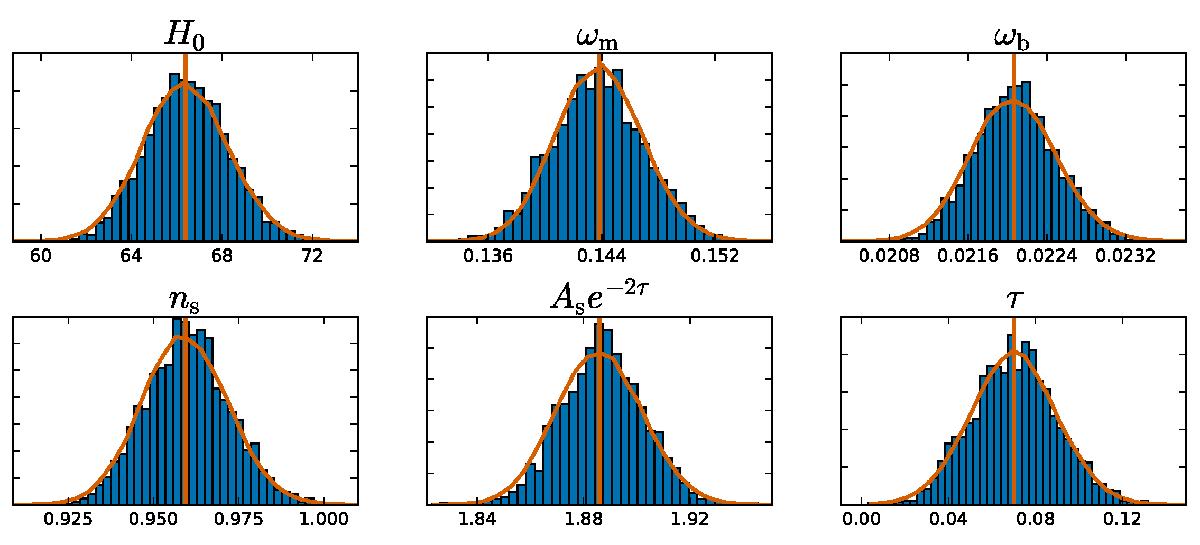
Histograms showing the distribution of best-fit ℓ < 800 parameters from simulations performed using our low-ℓ approximation. The vertical line is the input fiducial model and the contours show the posteriors from an ℓ < 800 chain using the actual Commander likelihood at low ℓ. The unbiased recovery of the fiducial parameters and agreement with the posteriors is a stringent test of the validity of our low-ℓ approximation. We note that these simulations, unlike the ones used in the main body of the paper to determine significance levels, have the prior on τ handled slightly differently, so as to allow us to use them as a test of the low-ℓ approximation (see Appendix B for discussion).
Current usage metrics show cumulative count of Article Views (full-text article views including HTML views, PDF and ePub downloads, according to the available data) and Abstracts Views on Vision4Press platform.
Data correspond to usage on the plateform after 2015. The current usage metrics is available 48-96 hours after online publication and is updated daily on week days.
Initial download of the metrics may take a while.