Fig. A.1
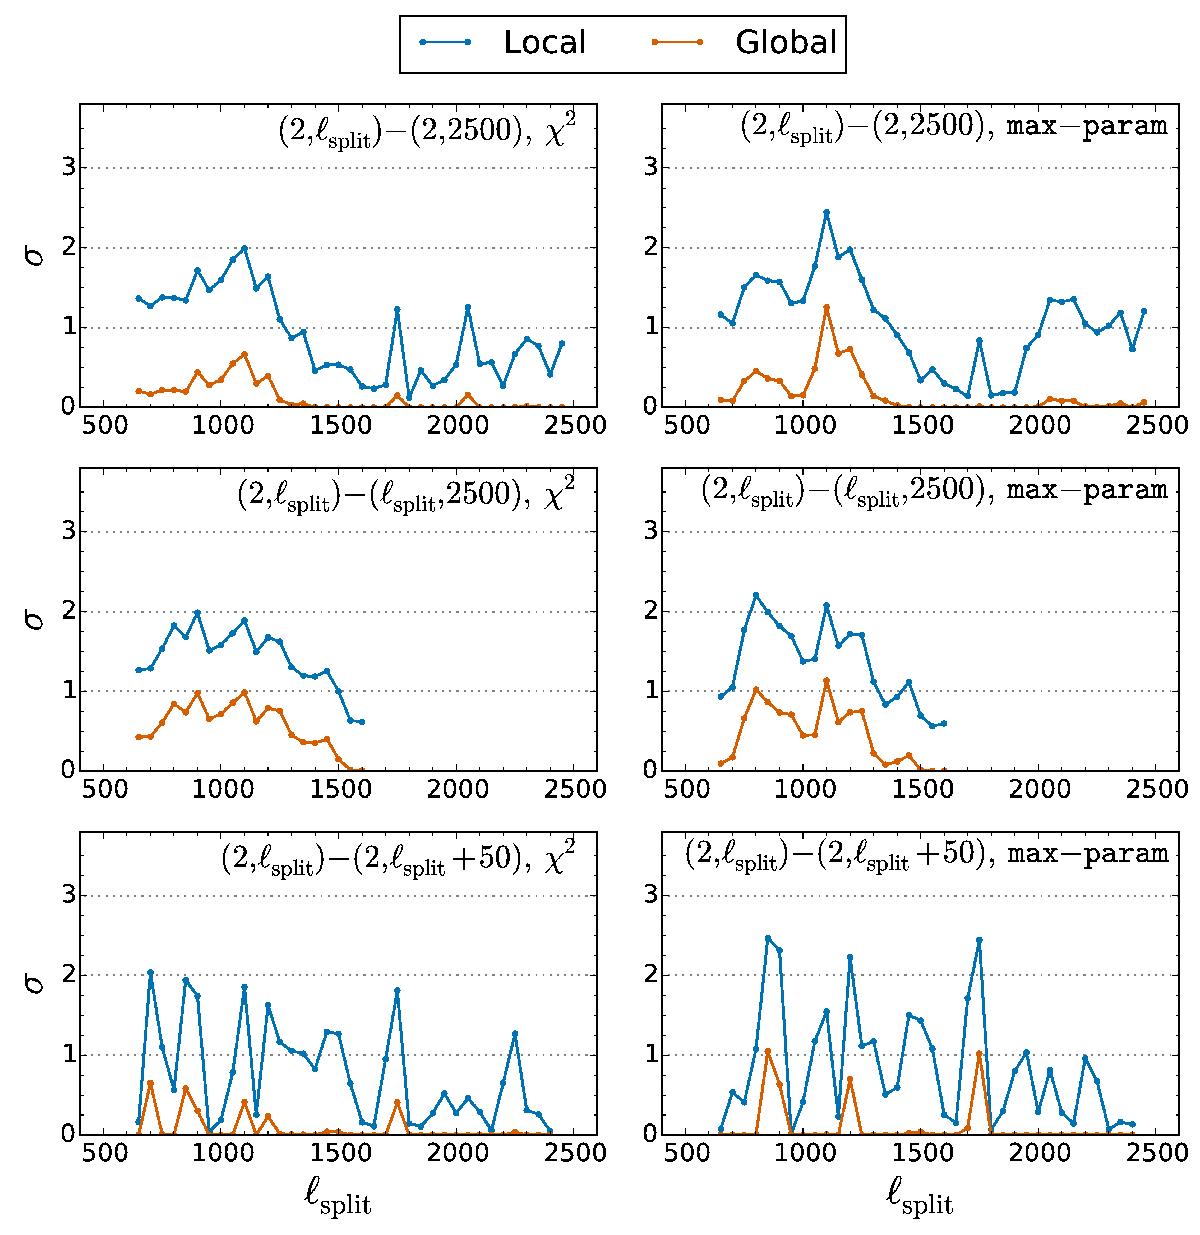
Significance levels (in units of effective σ) of the parameter shifts between two multipole ranges, according to a given statistic, as a function of ℓsplit. The specific choice of the two multipole ranges and the statistic used are labelled on each panel. The blue line is the “local” significance, calculated as described in Sect. 3.3. The orange line is the “global” significance which should be used to interpret the significance of any outliers we find (see Appendix A for further description).
Current usage metrics show cumulative count of Article Views (full-text article views including HTML views, PDF and ePub downloads, according to the available data) and Abstracts Views on Vision4Press platform.
Data correspond to usage on the plateform after 2015. The current usage metrics is available 48-96 hours after online publication and is updated daily on week days.
Initial download of the metrics may take a while.