Fig. 4
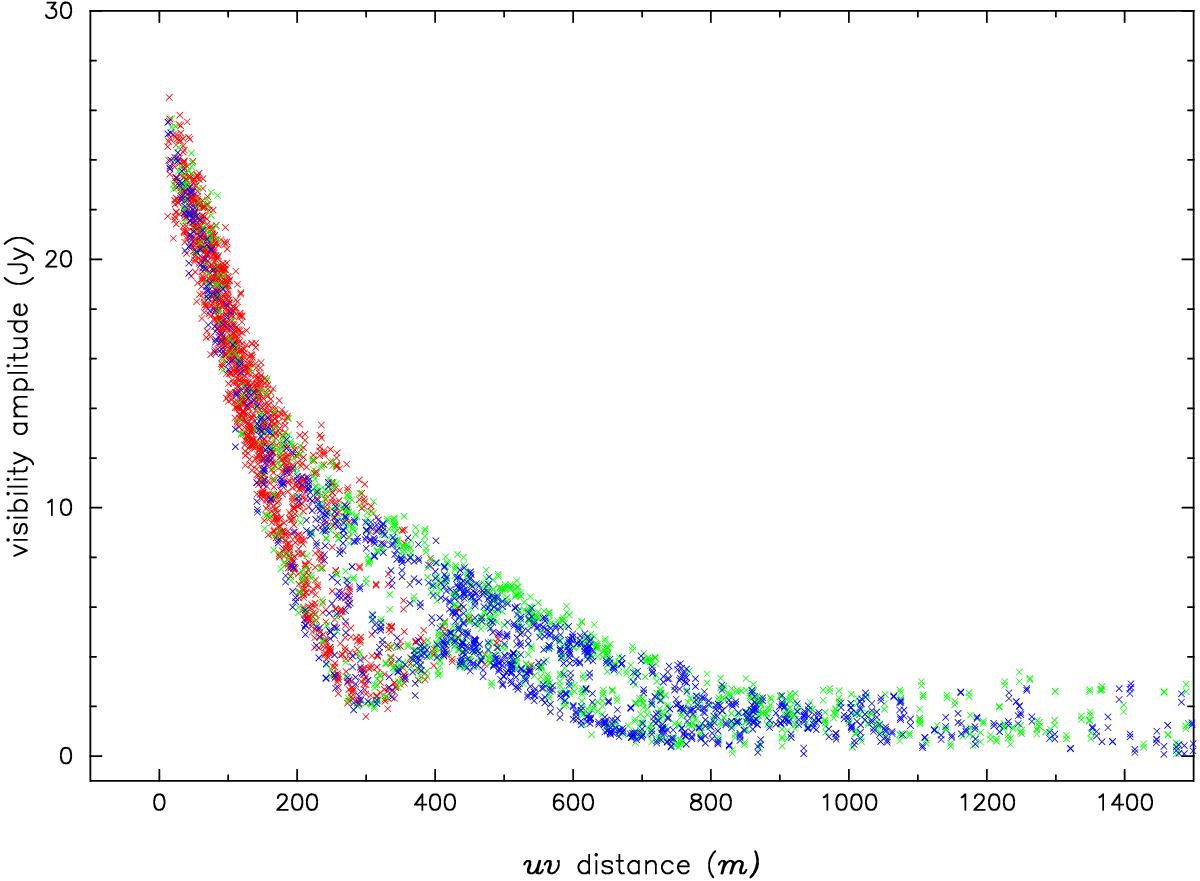
Visibility amplitudes of the maser emission against the baseline lengths. The visibilities are taken from the maser emission peak channel at 4 km s-1 from the three execution blocks (one from 2016 April 21 in red, and two from 2016 September 9 in green and blue). Only visibilities with baseline lengths shorter than 1500 m are shown.
Current usage metrics show cumulative count of Article Views (full-text article views including HTML views, PDF and ePub downloads, according to the available data) and Abstracts Views on Vision4Press platform.
Data correspond to usage on the plateform after 2015. The current usage metrics is available 48-96 hours after online publication and is updated daily on week days.
Initial download of the metrics may take a while.