Fig. 3
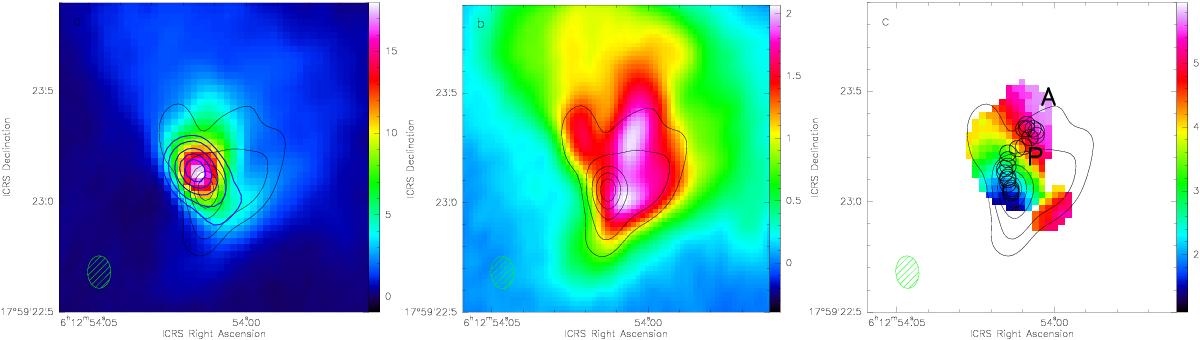
Maps of the integrated emission in the CH3OH 141−140 A−+ line (a) and 161−152 A− line (b). The thick blue contours in the panel a show the map at the velocity of the peak brightness. c) The first-moment map of the maser emission with the intensity threshold of 0.9 Jy beam-1 (which corresponds to approximately 600 K). The chain of circles shows the positions of the emission peaks in different spectral channels. The locations of the pre-burst and after-burst 6.7 GHz maser clusters are indicated. The thin contours in all panels show the 0.8 mm continuum emission. The contour levels are 0.1, 0.2, 0.4, 0.6, and 0.8 of the peak intensity. The synthesized ALMA beam is shown in the lower left corner.
Current usage metrics show cumulative count of Article Views (full-text article views including HTML views, PDF and ePub downloads, according to the available data) and Abstracts Views on Vision4Press platform.
Data correspond to usage on the plateform after 2015. The current usage metrics is available 48-96 hours after online publication and is updated daily on week days.
Initial download of the metrics may take a while.