Fig. 2
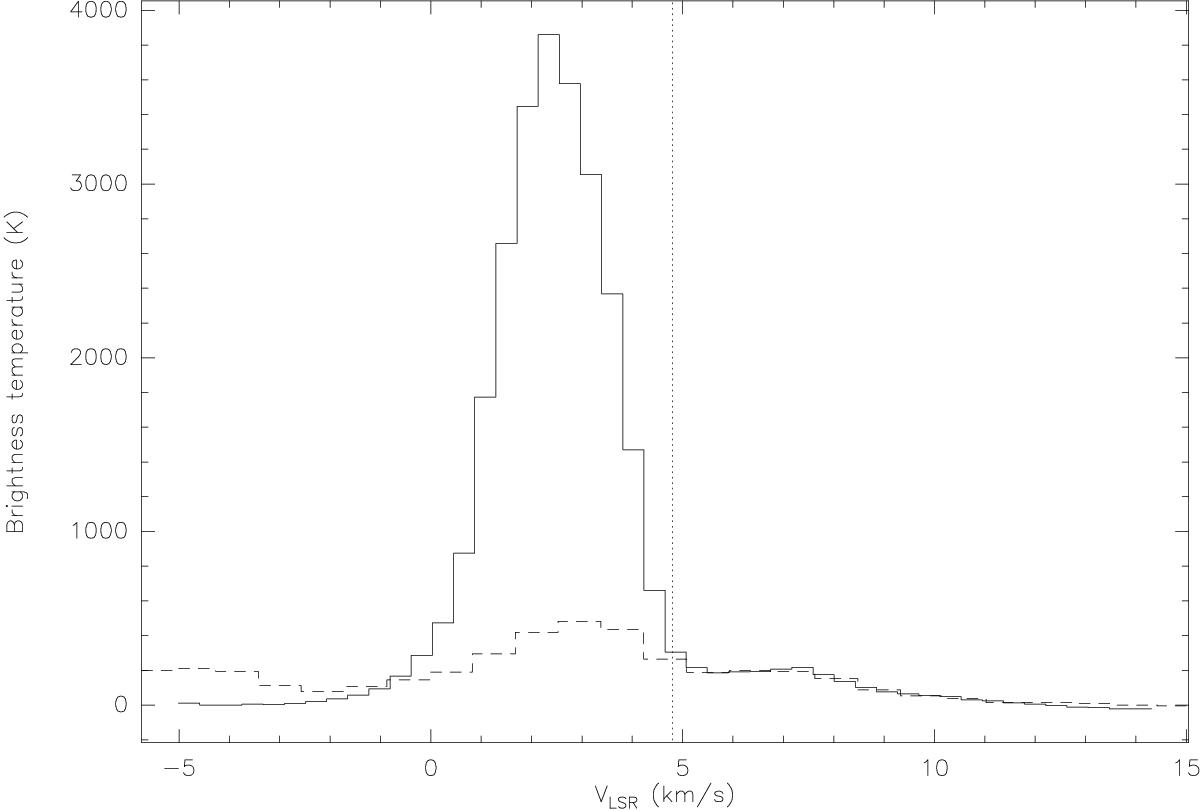
Spectrum of the brightness temperature in the masing methanol 141−140 A−+ line on the velocity axis (zero velocity corresponds to the rest frequency of this transition) within the synthesized beam toward the maser brightness peak (solid line). The dashed line shows the spectrum centered on the CH3OH 161−152 A− line. The intensity of this line is multiplied by a factor of 3. The dotted vertical line indicates the systemic velocity of the S255IR-SMA1 clump (4.8 km s-1), as found by Zinchenko et al. (2015).
Current usage metrics show cumulative count of Article Views (full-text article views including HTML views, PDF and ePub downloads, according to the available data) and Abstracts Views on Vision4Press platform.
Data correspond to usage on the plateform after 2015. The current usage metrics is available 48-96 hours after online publication and is updated daily on week days.
Initial download of the metrics may take a while.