Fig. 1
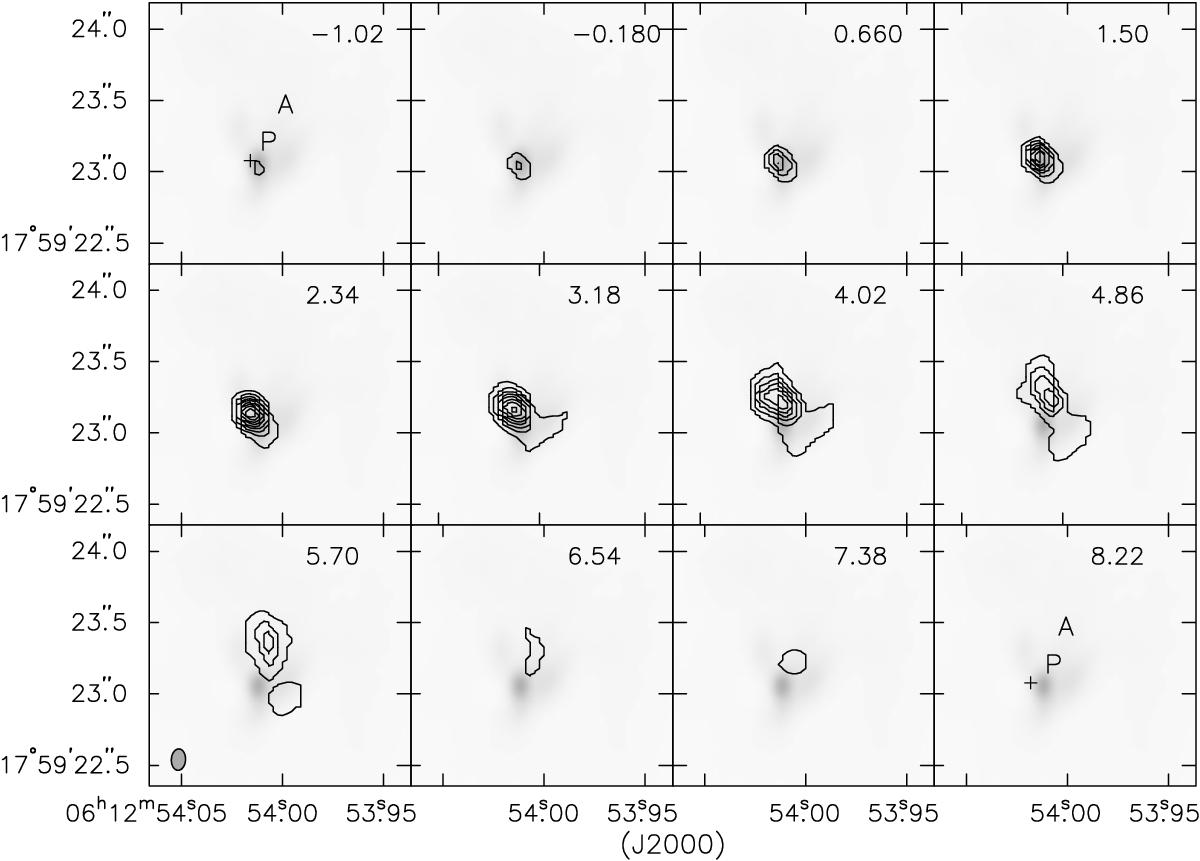
Channel map of the CH3OH maser emission toward S255IR-SMA1. The CH3OH emission is shown in contours, with levels at 0.6, 1.2, 1.8, 2.4, 3.0, 3.6, 4.2, 4.8, and 5.4 Jy/beam. The continuum emission at 335 GHz is displayed in grayscale. The datacube has a channel width of 0.42 km s-1, and maps of only every other channel starting from that at –1.02 km s-1 are shown. Positions of the 5 GHz radio continuum and those of the pre-burst and after-burst CH3OH maser clusters reported by Moscadelli et al. (2017) are labeled for reference by the cross, P, and A, respectively, in the first and last channel. The synthesized ALMA beam is shown in the lower left corner.
Current usage metrics show cumulative count of Article Views (full-text article views including HTML views, PDF and ePub downloads, according to the available data) and Abstracts Views on Vision4Press platform.
Data correspond to usage on the plateform after 2015. The current usage metrics is available 48-96 hours after online publication and is updated daily on week days.
Initial download of the metrics may take a while.