Fig. B.1
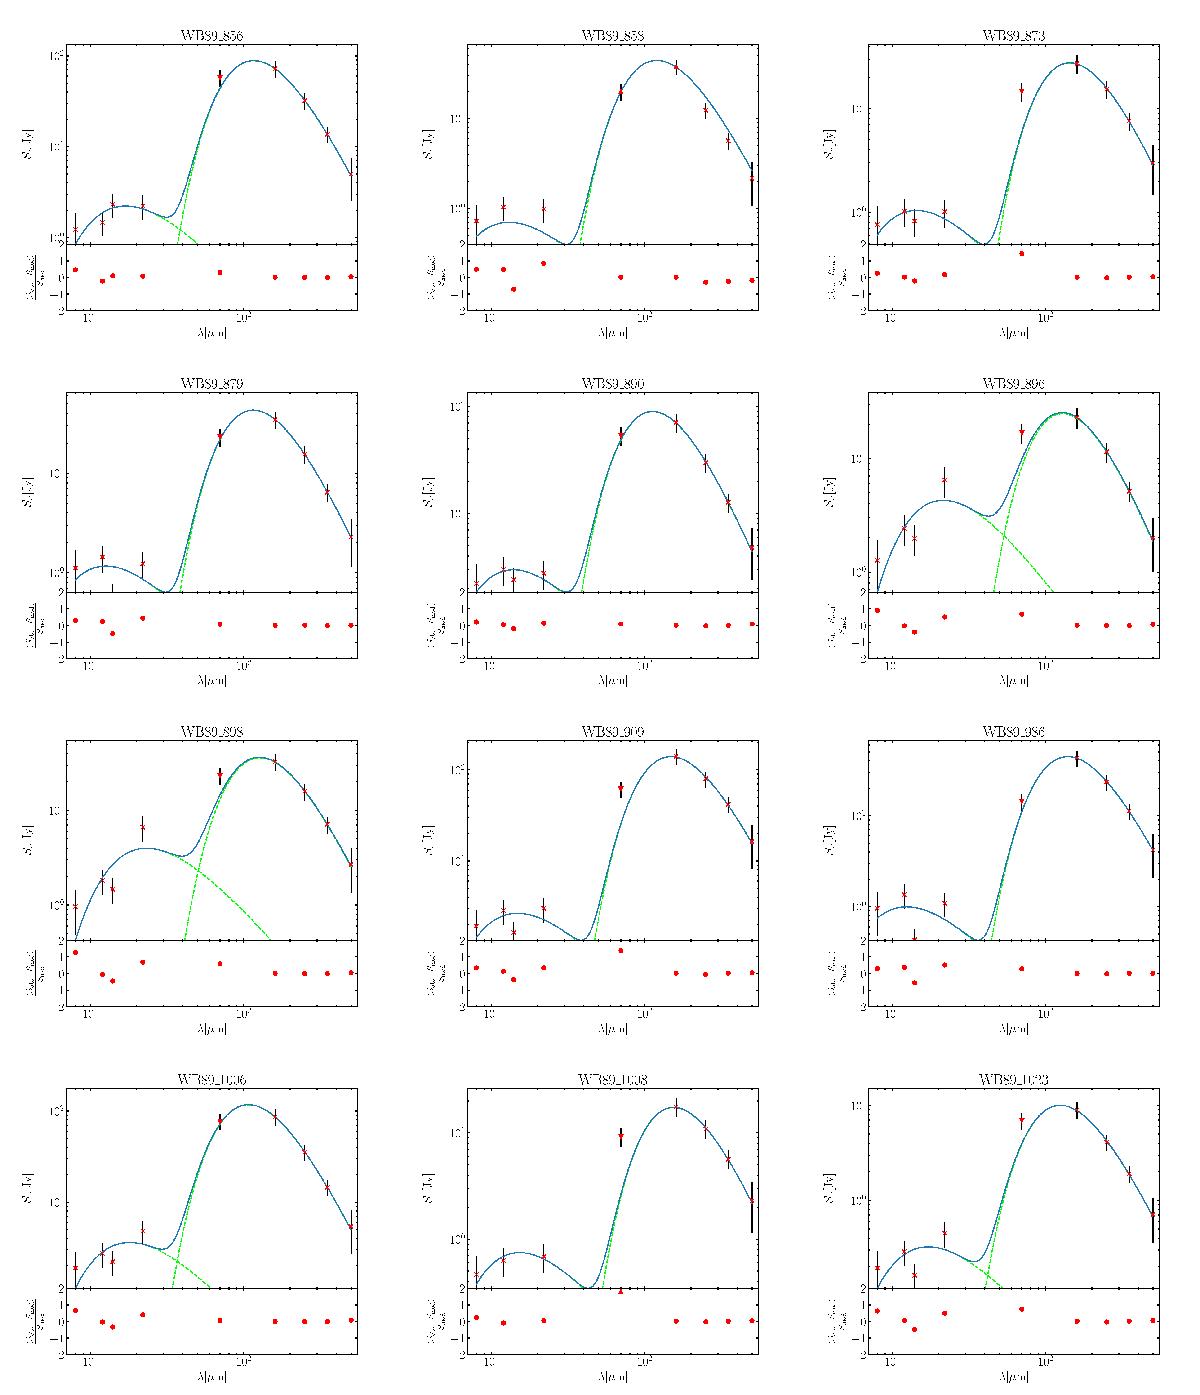
SED fit (top panel) and the residuals (Sobs−Smod) /Sobs (bottom panel for each source). In the top panel, the extracted fluxes are indicated by the red crosses, and upper and lower limits are indicated by triangles pointing downwards and upwards, respectively. The best fit curve is indicated in blue, and the separate contribution of the grey- and black-body is shown by the green dashed lines. If the residuals in the bottom panel exceed |2|, the point is indicated by a triangle.
Current usage metrics show cumulative count of Article Views (full-text article views including HTML views, PDF and ePub downloads, according to the available data) and Abstracts Views on Vision4Press platform.
Data correspond to usage on the plateform after 2015. The current usage metrics is available 48-96 hours after online publication and is updated daily on week days.
Initial download of the metrics may take a while.