Fig. 4
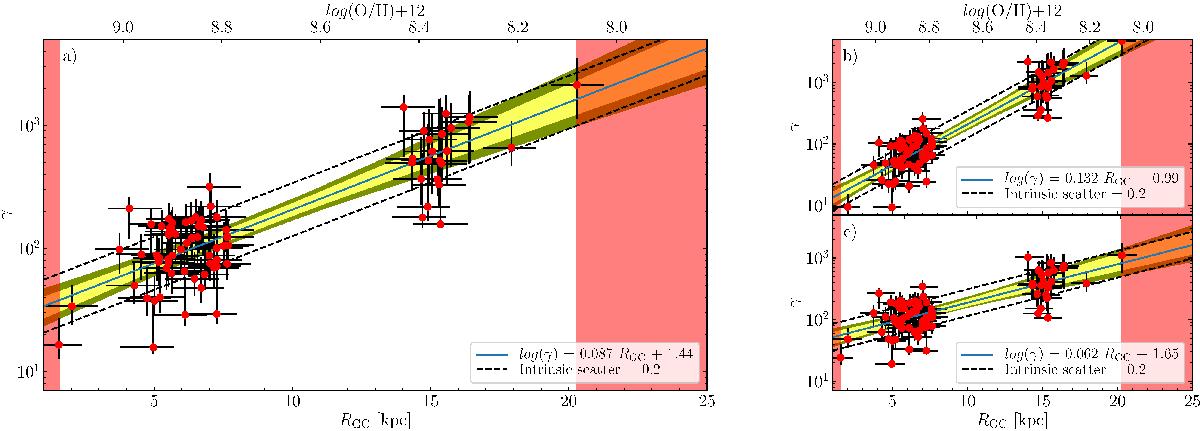
Variation of the gas-to-dust ratio with galactocentric radius, for our fiducial case (panel a), considering a CO/C18O galactocentric gradient (panel b), and assuming that the abundance of CO follows the radial oxygen gradient, rather than the C/H (panel c). The thick blue lines indicate the best fit, reported in the bottom right corner; the 68% and 95% highest probability density intervals of the fit parameters are indicated by the light and dark yellow-shaded regions, respectively. The intrinsic scatter is indicated by the dashed lines. For comparison with external galaxies log (O/H) + 12 is shown on the top axis.
Current usage metrics show cumulative count of Article Views (full-text article views including HTML views, PDF and ePub downloads, according to the available data) and Abstracts Views on Vision4Press platform.
Data correspond to usage on the plateform after 2015. The current usage metrics is available 48-96 hours after online publication and is updated daily on week days.
Initial download of the metrics may take a while.