Fig. 2
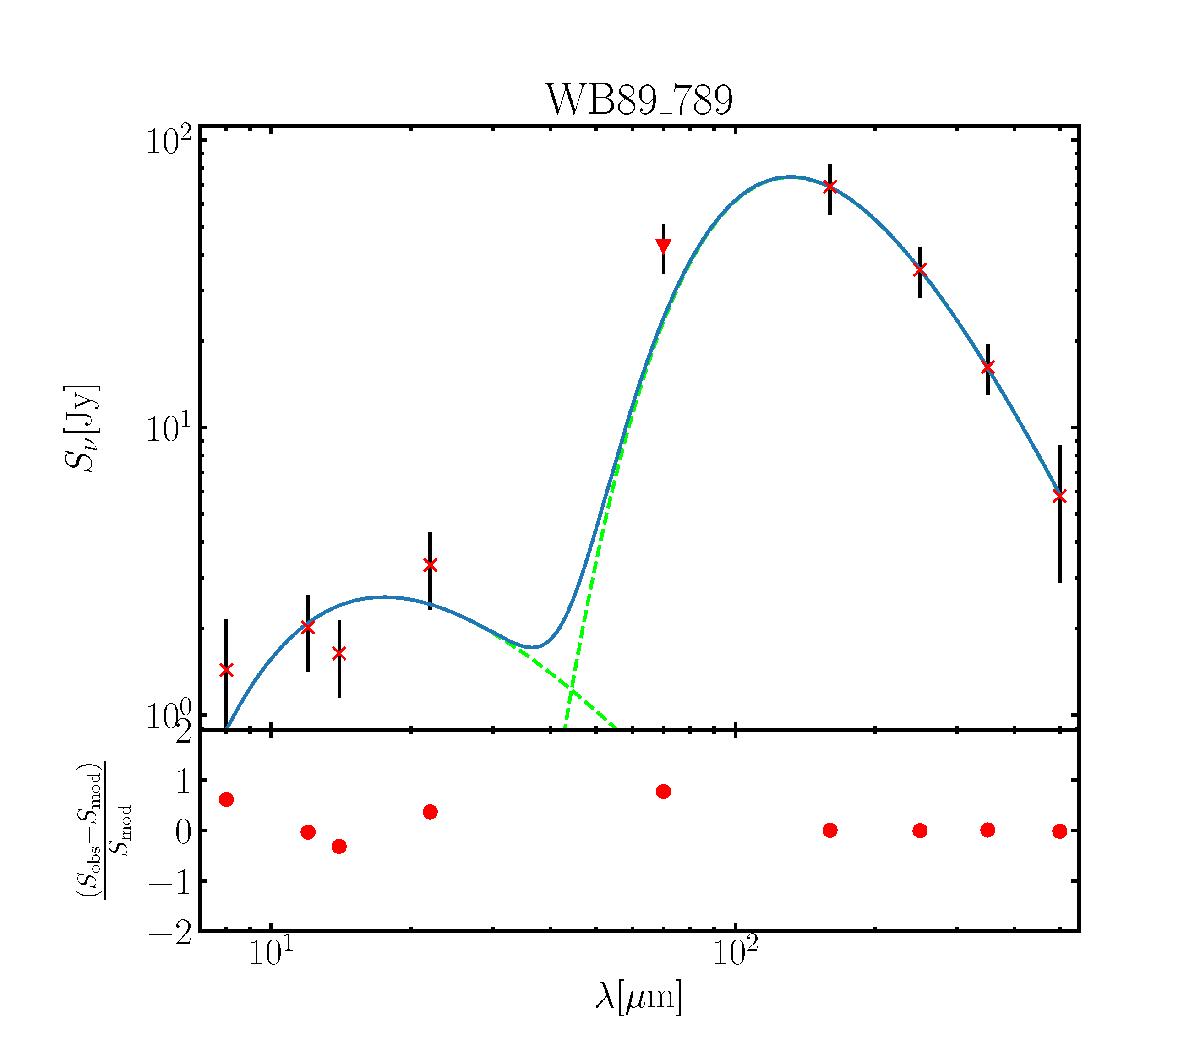
Top: example of the SED fit for WB_789, hosting one of the the furthest clusters from the galactic centre yet detected (Brand & Wouterloot 2007). Extracted fluxes are indicated by the red crosses, and upper and lower limits are indicated by triangles pointing downwards and upwards, respectively. The best fit curve is indicated in blue, and the separate contributions of the grey and black bodies are shown by the green dashed lines. Bottom: residuals calculated as (Sobs−Smod) /Sobs. The SED and their residuals for all the other sources are included in Fig. B.1.
Current usage metrics show cumulative count of Article Views (full-text article views including HTML views, PDF and ePub downloads, according to the available data) and Abstracts Views on Vision4Press platform.
Data correspond to usage on the plateform after 2015. The current usage metrics is available 48-96 hours after online publication and is updated daily on week days.
Initial download of the metrics may take a while.