Fig. 2
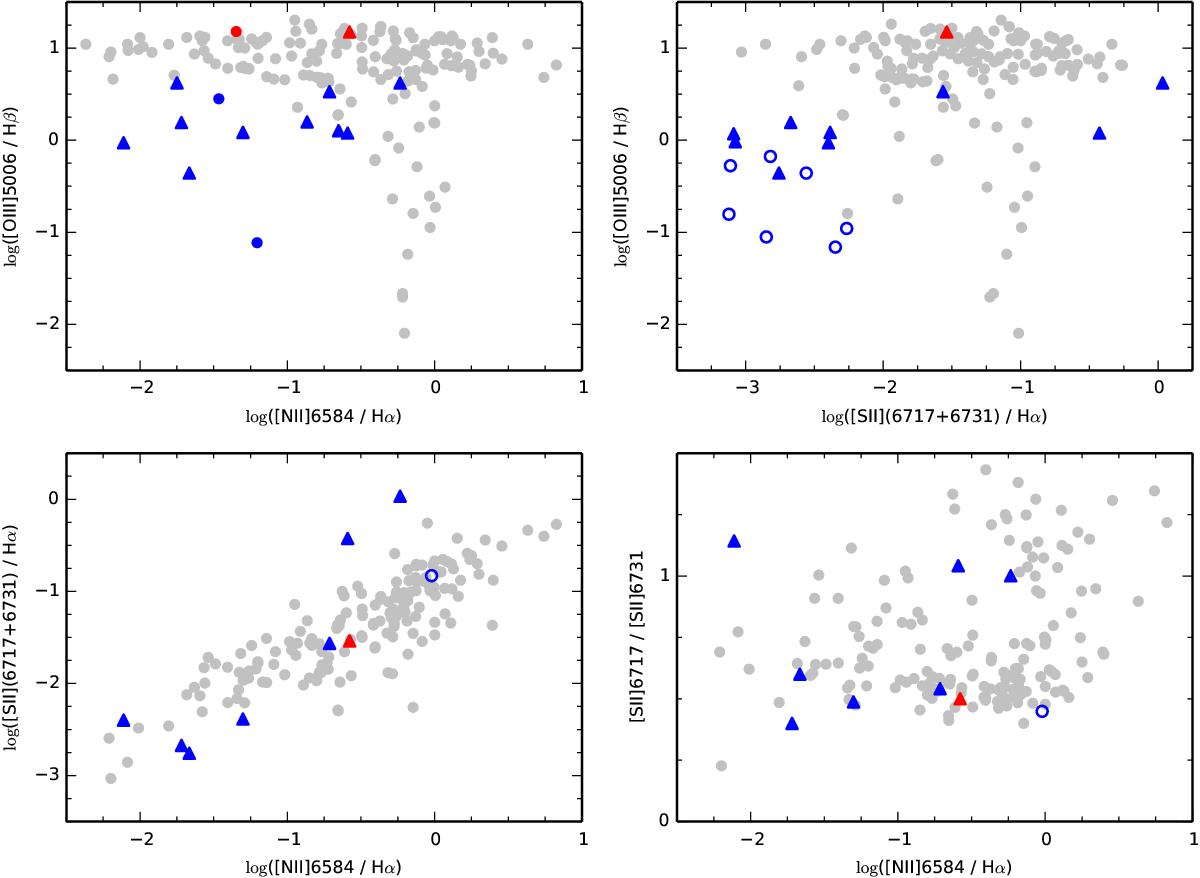
Kniazev et al. (2008) diagrams used for distinguishing between PNe and H ii regions. The SySt are marked with blue symbols and PNe with gray symbols. The SySt that fall into the PNe region in the [O iii] diagnostic diagram are marked with red symbols. The S-type SySt are marked with open circles, the D′-type SySt with full circles, and D-type SySt with triangles.
Current usage metrics show cumulative count of Article Views (full-text article views including HTML views, PDF and ePub downloads, according to the available data) and Abstracts Views on Vision4Press platform.
Data correspond to usage on the plateform after 2015. The current usage metrics is available 48-96 hours after online publication and is updated daily on week days.
Initial download of the metrics may take a while.