Fig. 1
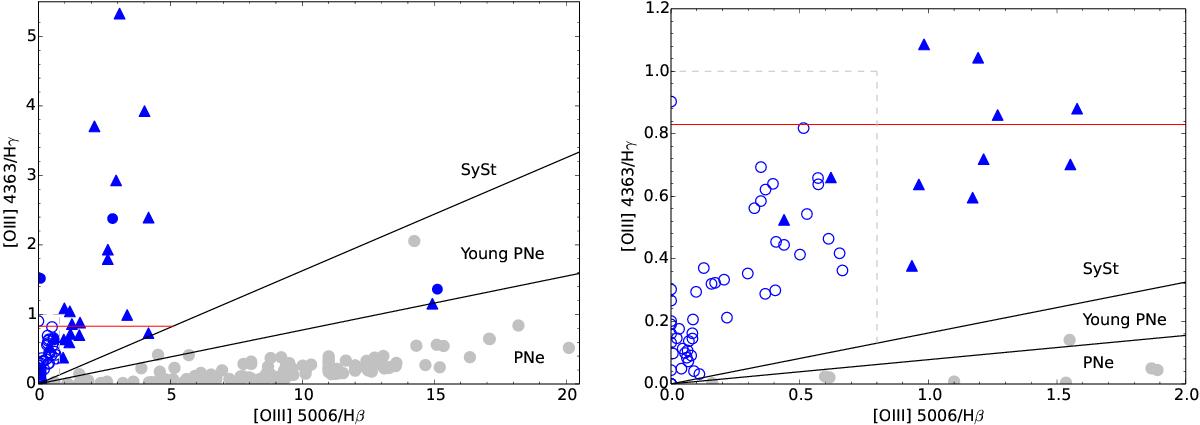
[O iii] diagnostic diagram of Gutierrez-Moreno et al. (1995) for SySt (blue symbols) and PNe (gray symbols) in the MW. The S-type SySt are marked with open circles, the D′-type SySt with full circles, and D-type SySt with triangles. The red line marks Kniazev et al. (2008) criterion for distinguishing between S- and D-type SySt. The gray lines indicate the regions of S- and D-type SySt proposed in this work. Left and right panel: same diagram, but with different zoom.
Current usage metrics show cumulative count of Article Views (full-text article views including HTML views, PDF and ePub downloads, according to the available data) and Abstracts Views on Vision4Press platform.
Data correspond to usage on the plateform after 2015. The current usage metrics is available 48-96 hours after online publication and is updated daily on week days.
Initial download of the metrics may take a while.