Fig. 2
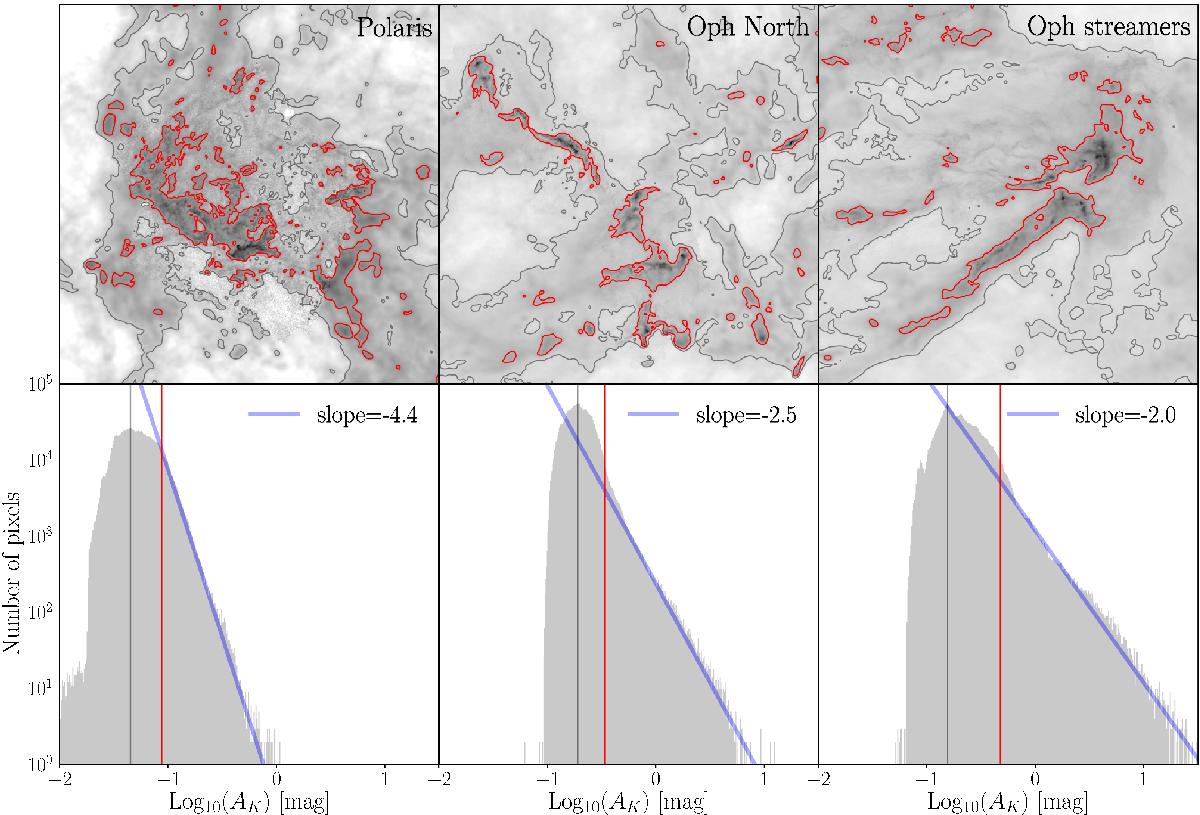
Column density map and respective PDF for a diffuse cloud (Polaris), a star formation poor cloud (Oph North), and a star forming rich cloud (Oph streamers). The red line on the map and on the PDF corresponds to the last closed contour while the gray line corresponds to the peak of the PDF. The blue line represents the slope of the distribution above the completeness limit. All maps cover about the same physical area of about 200 pc2.
Current usage metrics show cumulative count of Article Views (full-text article views including HTML views, PDF and ePub downloads, according to the available data) and Abstracts Views on Vision4Press platform.
Data correspond to usage on the plateform after 2015. The current usage metrics is available 48-96 hours after online publication and is updated daily on week days.
Initial download of the metrics may take a while.