Fig. 3
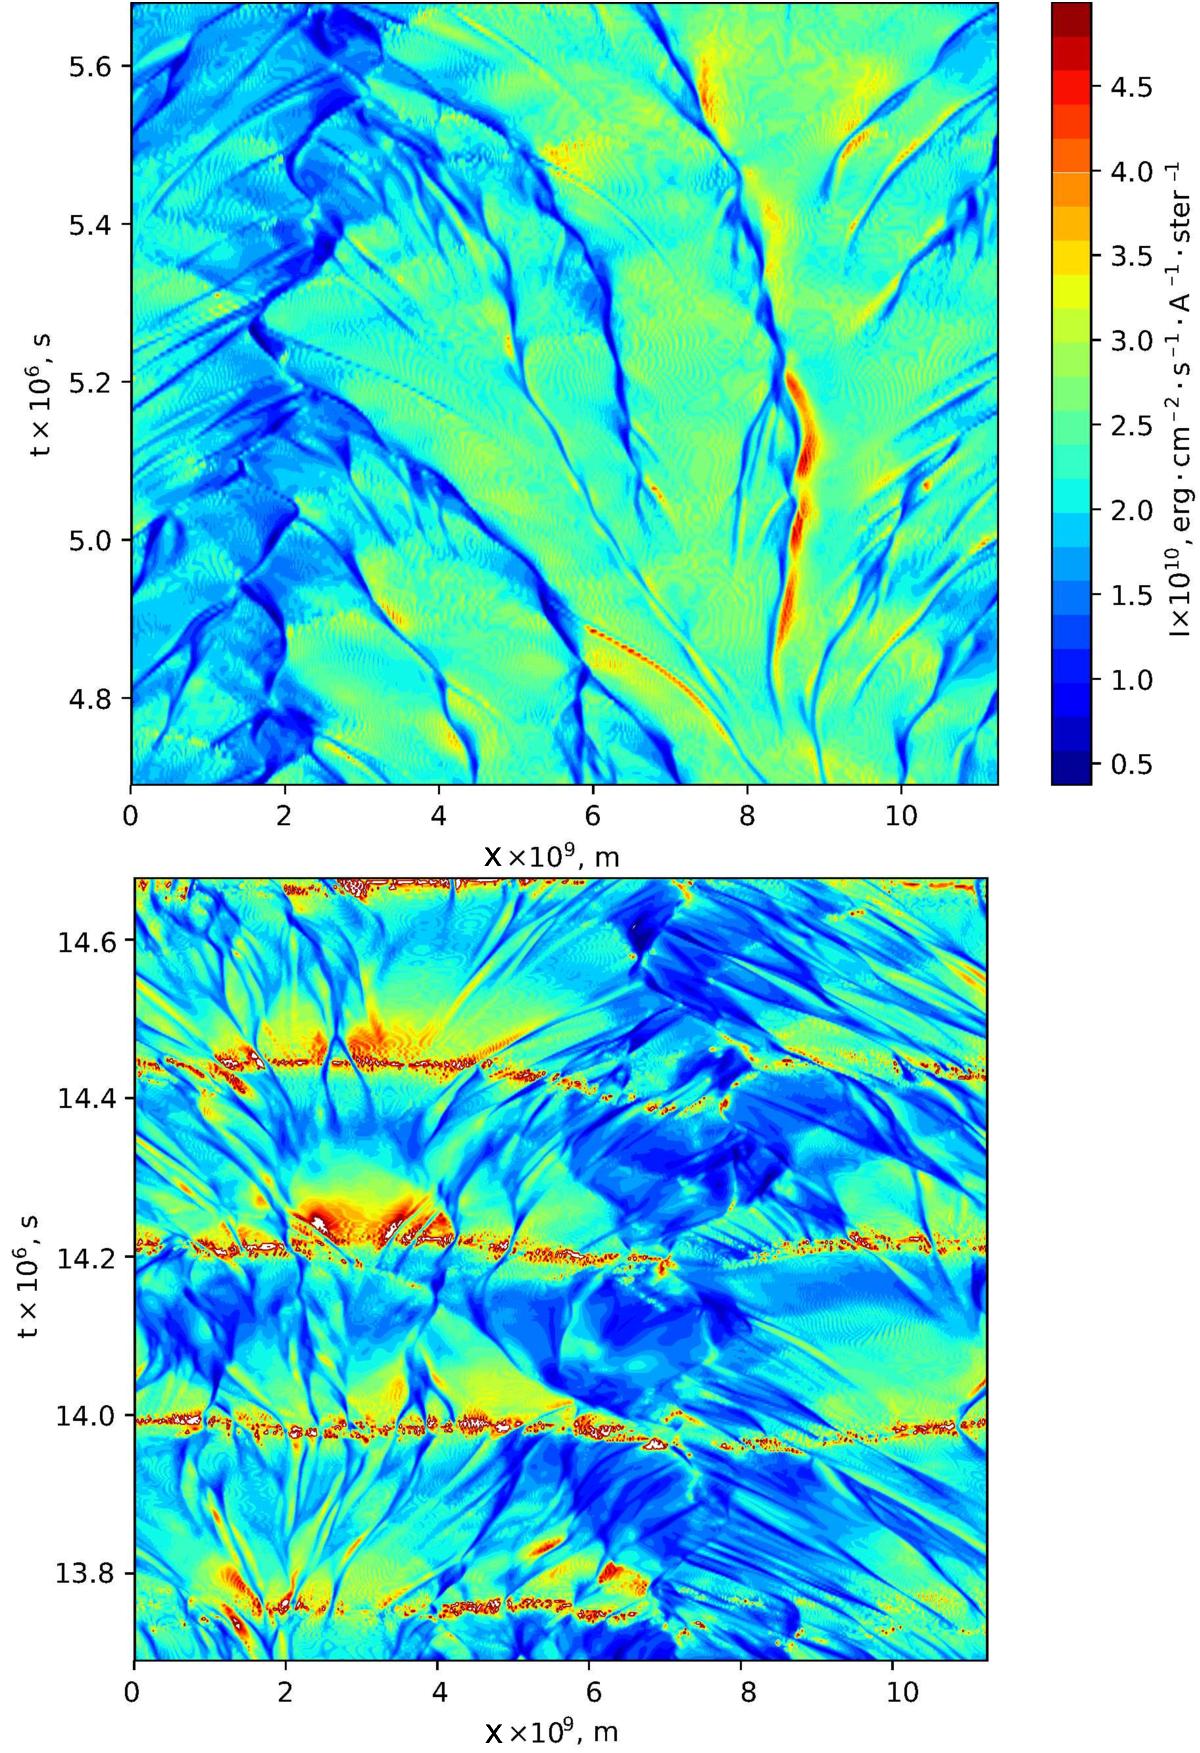
Spatio-temporal evolution of the emergent intensity directed in vertical direction (μ = 1). The upper panel shows a time interval when pulsations have not set in (model gt56g20n01), the bottom panel a time interval with fully developed pulsations (model gt56g20n04). Time, spatial, and colour scales are identical for both panels.
Current usage metrics show cumulative count of Article Views (full-text article views including HTML views, PDF and ePub downloads, according to the available data) and Abstracts Views on Vision4Press platform.
Data correspond to usage on the plateform after 2015. The current usage metrics is available 48-96 hours after online publication and is updated daily on week days.
Initial download of the metrics may take a while.