Fig. 18
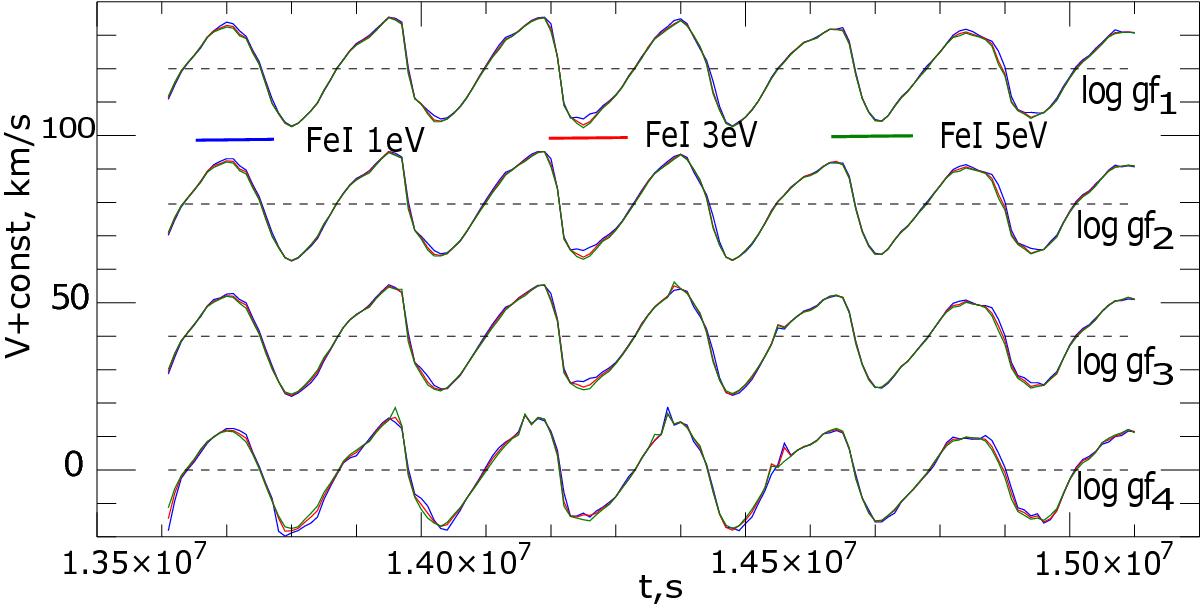
Radial velocities as a function of time obtained by measuring the Doppler shift of Fe i λ5500 Å Ei = 1 eV (blue), 3 eV (red), 5 eV (green) line cores using parabolic fits. Four different line strengths are shown whose EWs are ordered according to their oscillator strength log gf1 > log gf2 > log gf3 > log gf4. The velocity curves are shifted by 40 km s-1 relative to each other for clarity.
Current usage metrics show cumulative count of Article Views (full-text article views including HTML views, PDF and ePub downloads, according to the available data) and Abstracts Views on Vision4Press platform.
Data correspond to usage on the plateform after 2015. The current usage metrics is available 48-96 hours after online publication and is updated daily on week days.
Initial download of the metrics may take a while.