Free Access
Fig. 13
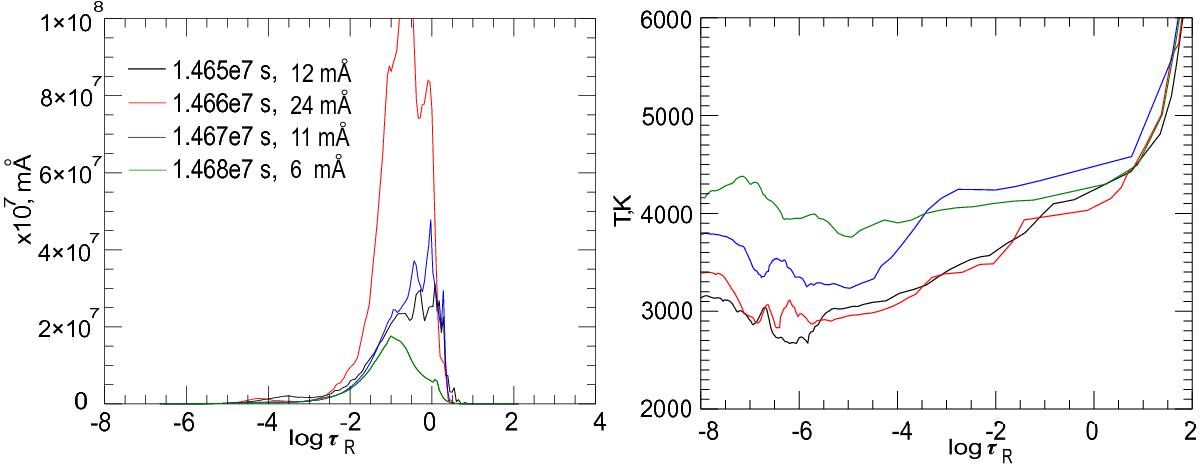
Time dependence of the non-normalized line equivalent width contribution functions of the weakest Fe i λ5500 Å Ei = 1 eV line (left panel) and the temperature profiles (right panel). The contribution functions and the temperature profiles for each instance in time are depicted in corresponding colours.
Current usage metrics show cumulative count of Article Views (full-text article views including HTML views, PDF and ePub downloads, according to the available data) and Abstracts Views on Vision4Press platform.
Data correspond to usage on the plateform after 2015. The current usage metrics is available 48-96 hours after online publication and is updated daily on week days.
Initial download of the metrics may take a while.