Fig. 1
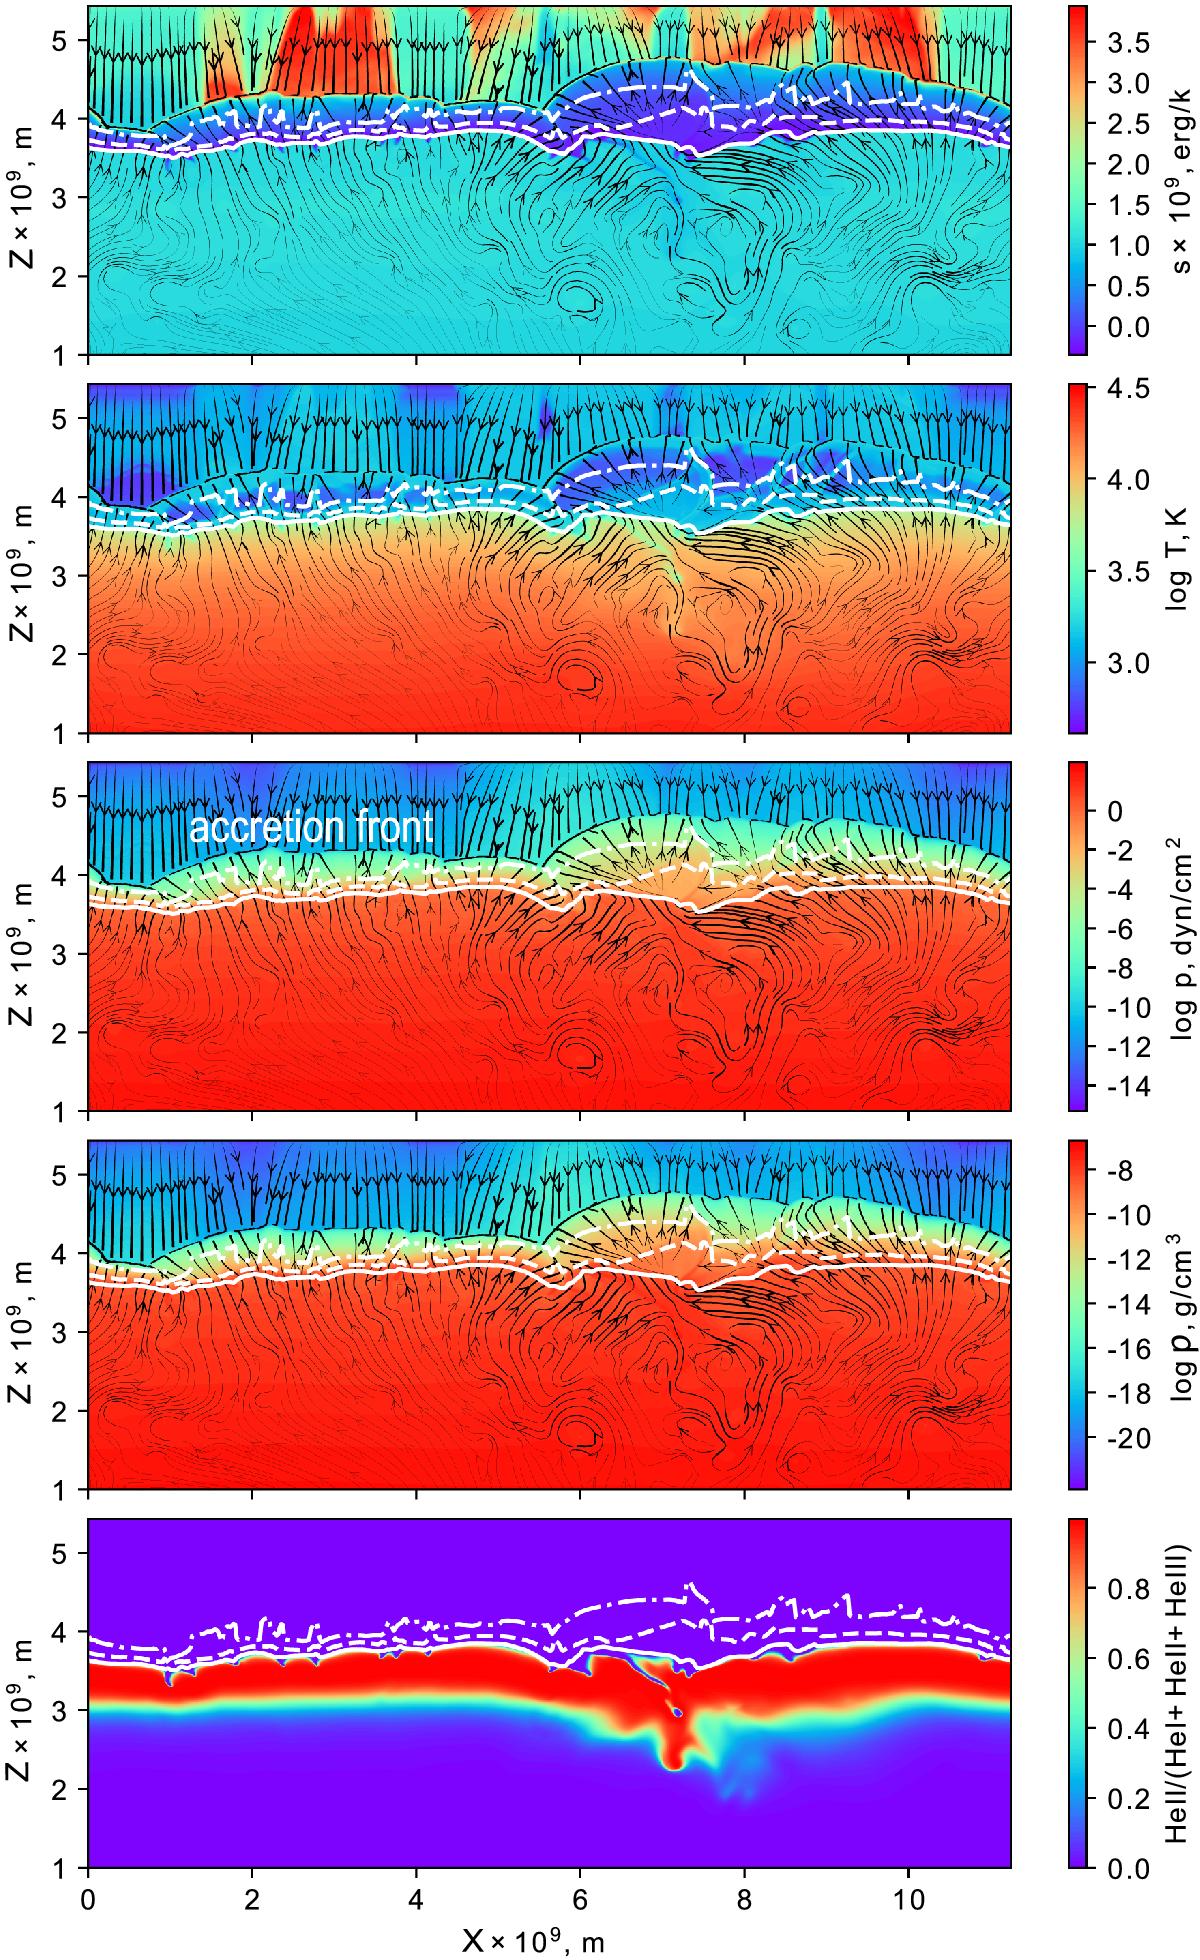
Entropy (top panel), temperature, pressure, density, and He ii ionization fraction nHe ii/ (nHe i + nHe ii + nHe iii) (bottom panel) as function of the horizontal and vertical coordinates at time t = 1.40 × 10⁷ s, which corresponds to an expanding phase. Pseudo-streamlines are shown as black solid lines. Surfaces of constant Rosseland optical depth are shown by white lines: τR = 1 (solid line), τR = 10-2 (dashed line), τR = 10-4 (dashed-dotted line).
Current usage metrics show cumulative count of Article Views (full-text article views including HTML views, PDF and ePub downloads, according to the available data) and Abstracts Views on Vision4Press platform.
Data correspond to usage on the plateform after 2015. The current usage metrics is available 48-96 hours after online publication and is updated daily on week days.
Initial download of the metrics may take a while.