Fig. 3
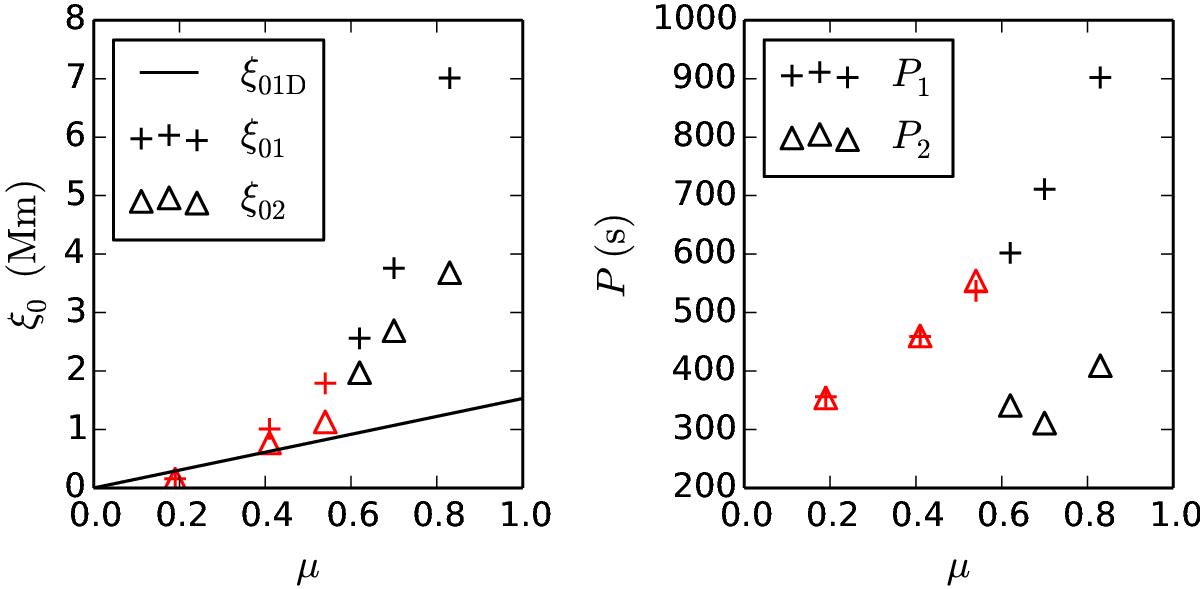
Dependence of amplitudes (left) and periods (right) of the vertical oscillation on the rain mass fraction μ at the beginning (ξ01, P1) and end (ξ02, P2) of the simulation. Values for low mass condensation regions for which the plasma remains trapped at the loop apex are shown in red. The solid line shows amplitudes predicted by 1D mechanical model by Verwichte et al. (2017).
Current usage metrics show cumulative count of Article Views (full-text article views including HTML views, PDF and ePub downloads, according to the available data) and Abstracts Views on Vision4Press platform.
Data correspond to usage on the plateform after 2015. The current usage metrics is available 48-96 hours after online publication and is updated daily on week days.
Initial download of the metrics may take a while.